Note
Click here to download the full example code
Converting from rotated latitude-longitude to regular latitude-longitude
In this recipe, we will be regridding from a rotated latitude-longitude source domain to a regular latitude-longitude destination domain.
Import cf-python, cf-plot and numpy:
import cfplot as cfp
import numpy as np

import cf
Read the field constructs using read function:
[<CF Field: id%UM_m01s03i463_vn1006(time(8), grid_latitude(432), grid_longitude(444))>]
Select the field by index and print its description to show properties of all constructs:
-----------------------------------------------------------
Field: id%UM_m01s03i463_vn1006 (ncvar%UM_m01s03i463_vn1006)
-----------------------------------------------------------
Conventions = 'CF-1.10'
_FillValue = -1073741824.0
history = 'Converted from UM/PP by cf-python v3.15.0'
lbproc = '8192'
lbtim = '122'
long_name = 'WIND GUST'
runid = 'aaaaa'
source = 'UM vn1006'
stash_code = '3463'
submodel = '1'
um_stash_source = 'm01s03i463'

Data(time(8), grid_latitude(432), grid_longitude(444)) = [[[5.587890625, ..., 5.1376953125]]]

Cell Method: time(8): maximum

Domain Axis: grid_latitude(432)
Domain Axis: grid_longitude(444)
Domain Axis: height(1)
Domain Axis: time(8)

Dimension coordinate: time
    axis = 'T'
    calendar = '360_day'
    standard_name = 'time'
    units = 'days since 2051-1-1'
    Data(time(8)) = [2051-04-14 01:30:00, ..., 2051-04-14 22:30:00] 360_day
    Bounds:calendar = '360_day'
    Bounds:units = 'days since 2051-1-1'
    Bounds:Data(time(8), 2) = [[2051-04-14 00:00:00, ..., 2051-04-15 00:00:00]] 360_day

Dimension coordinate: height
    axis = 'Z'
    positive = 'up'
    standard_name = 'height'
    units = 'm'
    Data(height(1)) = [-1.0] m

Dimension coordinate: grid_latitude
    axis = 'Y'
    standard_name = 'grid_latitude'
    units = 'degrees'
    Data(grid_latitude(432)) = [-24.474999085068703, ..., 22.93500065803528] degrees
    Bounds:units = 'degrees'
    Bounds:Data(grid_latitude(432), 2) = [[-24.52999908477068, ..., 22.990000657737255]] degrees

Dimension coordinate: grid_longitude
    axis = 'X'
    standard_name = 'grid_longitude'
    units = 'degrees'
    Data(grid_longitude(444)) = [-29.47499145567417, ..., 19.255008280277252] degrees
    Bounds:units = 'degrees'
    Bounds:Data(grid_longitude(444), 2) = [[-29.52999145537615, ..., 19.31000827997923]] degrees

Auxiliary coordinate: latitude
    standard_name = 'latitude'
    units = 'degrees_north'
    Data(grid_latitude(432), grid_longitude(444)) = [[20.576467692711244, ..., 66.90225185059428]] degrees_north
    Bounds:units = 'degrees_north'
    Bounds:Data(grid_latitude(432), grid_longitude(444), 4) = [[[20.50585365074419, ..., 66.82752183591474]]] degrees_north

Auxiliary coordinate: longitude
    standard_name = 'longitude'
    units = 'degrees_east'
    Data(grid_latitude(432), grid_longitude(444)) = [[-10.577446822867152, ..., 68.72895292160315]] degrees_east
    Bounds:units = 'degrees_east'
    Bounds:Data(grid_latitude(432), grid_longitude(444), 4) = [[[-10.602339269012642, ..., 68.7357360850507]]] degrees_east

Coordinate reference: grid_mapping_name:rotated_latitude_longitude
    Coordinate conversion:grid_mapping_name = rotated_latitude_longitude
    Coordinate conversion:grid_north_pole_latitude = 39.25
    Coordinate conversion:grid_north_pole_longitude = 198.0
    Dimension Coordinate: grid_longitude
    Dimension Coordinate: grid_latitude
    Auxiliary Coordinate: longitude
    Auxiliary Coordinate: latitude
Access the time coordinate of the gust field and retrieve the datetime values of the time coordinate:
print(gust.coordinate("time").datetime_array)
[cftime.Datetime360Day(2051, 4, 14, 1, 30, 0, 0, has_year_zero=True)
 cftime.Datetime360Day(2051, 4, 14, 4, 30, 0, 0, has_year_zero=True)
 cftime.Datetime360Day(2051, 4, 14, 7, 30, 0, 0, has_year_zero=True)
 cftime.Datetime360Day(2051, 4, 14, 10, 30, 0, 0, has_year_zero=True)
 cftime.Datetime360Day(2051, 4, 14, 13, 30, 0, 0, has_year_zero=True)
 cftime.Datetime360Day(2051, 4, 14, 16, 30, 0, 0, has_year_zero=True)
 cftime.Datetime360Day(2051, 4, 14, 19, 30, 0, 0, has_year_zero=True)
 cftime.Datetime360Day(2051, 4, 14, 22, 30, 0, 0, has_year_zero=True)]
Create a new instance of the cf.dt class with a specified year, month, day, hour, minute, second and microsecond. Then store the result in the variable
test:
2051-04-14 01:30:00
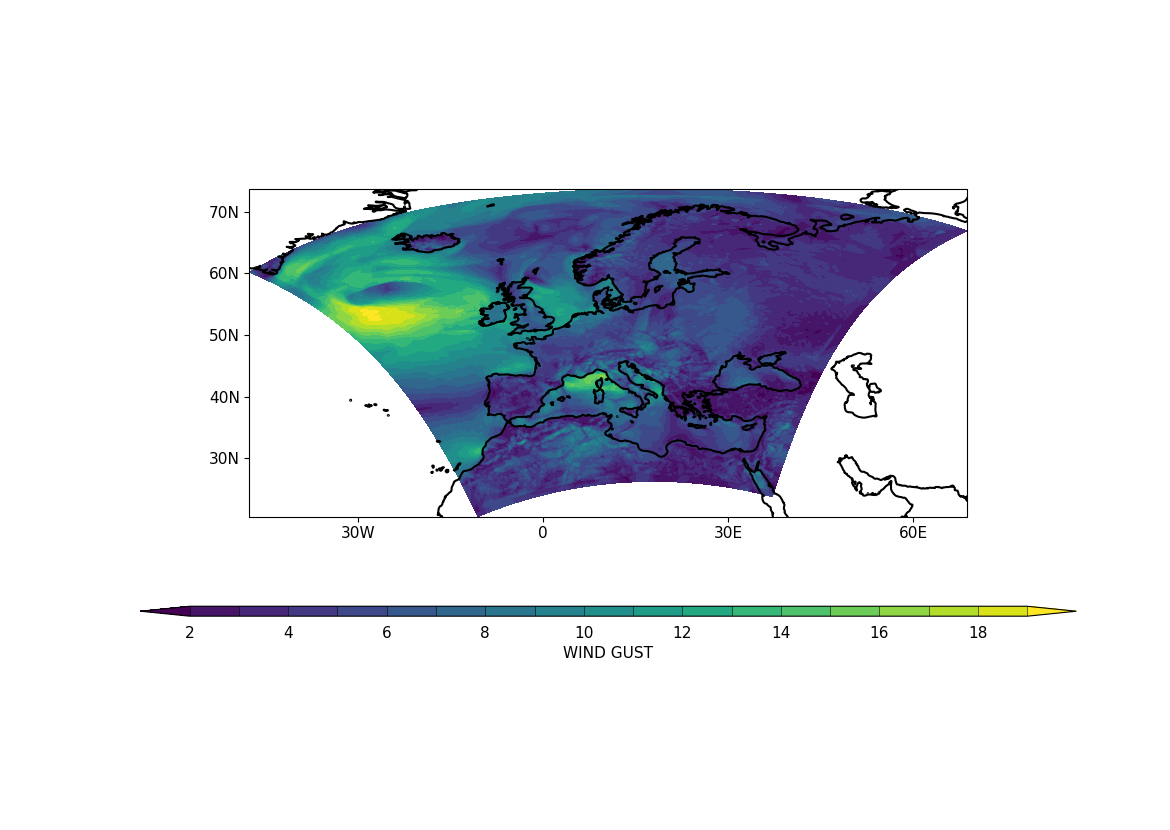
Plot the wind gust by creating a subspace for the specified variable
testusing cfplot.con. Here cfplot.mapset is used to set the mapping parameters like setting the map resolution to 50m:
cfp.mapset(resolution="50m")
cfp.con(gust.subspace(T=test), lines=False)
/home/sadie/anaconda3/envs/cf-env/lib/python3.8/site-packages/cartopy/crs.py:228: ShapelyDeprecationWarning: __len__ for multi-part geometries is deprecated and will be removed in Shapely 2.0. Check the length of the `geoms` property instead to get the  number of parts of a multi-part geometry.
  if len(multi_line_string) > 1:
/home/sadie/anaconda3/envs/cf-env/lib/python3.8/site-packages/cartopy/crs.py:280: ShapelyDeprecationWarning: Iteration over multi-part geometries is deprecated and will be removed in Shapely 2.0. Use the `geoms` property to access the constituent parts of a multi-part geometry.
  for line in multi_line_string:
/home/sadie/anaconda3/envs/cf-env/lib/python3.8/site-packages/cartopy/crs.py:347: ShapelyDeprecationWarning: __len__ for multi-part geometries is deprecated and will be removed in Shapely 2.0. Check the length of the `geoms` property instead to get the  number of parts of a multi-part geometry.
  if len(p_mline) > 0:
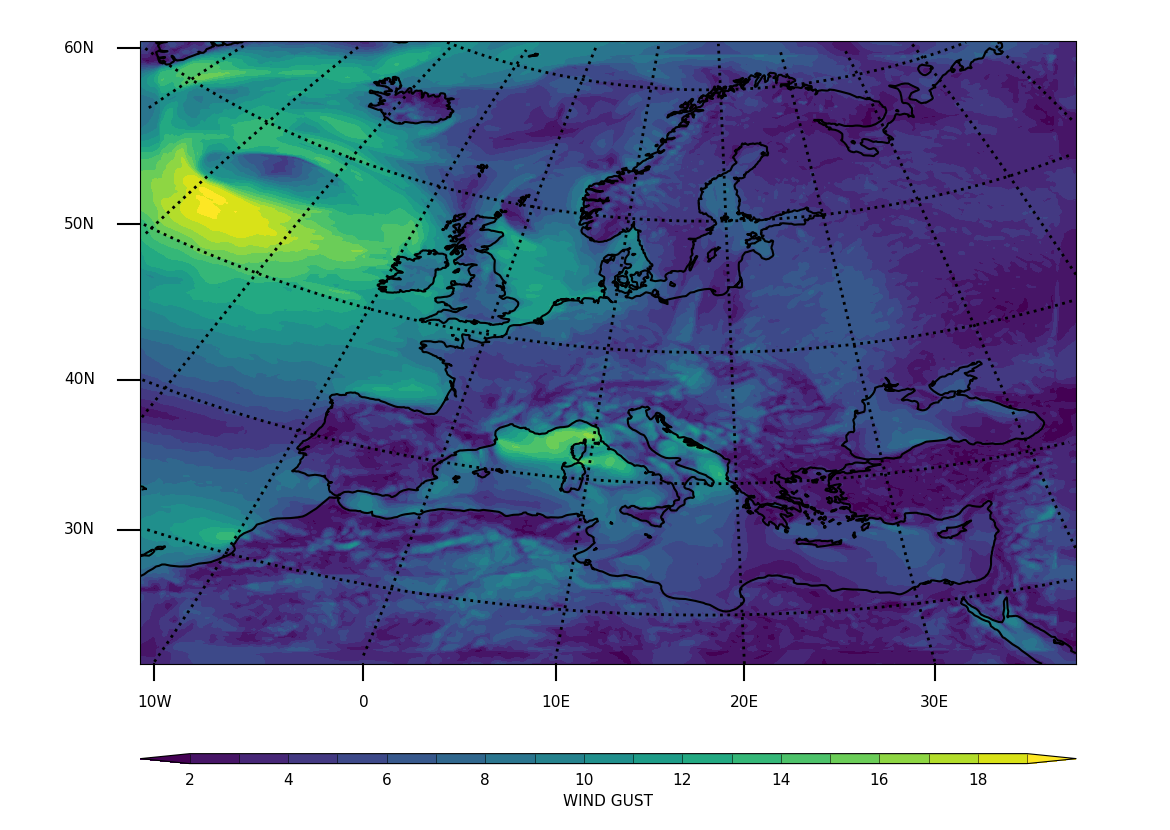
To see the rotated pole data on the native grid, the above steps are repeated and projection is set to rotated in cfplot.mapset:
cfp.mapset(resolution="50m", proj="rotated")
cfp.con(gust.subspace(T=test), lines=False)
/home/sadie/anaconda3/envs/cf-env/lib/python3.8/site-packages/cartopy/io/__init__.py:241: DownloadWarning: Downloading: https://naciscdn.org/naturalearth/50m/physical/ne_50m_coastline.zip
  warnings.warn('Downloading: {}'.format(url), DownloadWarning)
Create dimension coordinates for the destination grid with the latitude and longitude values for Europe. np.linspace generates evenly spaced values between the specified latitude and longitude range. Bounds of the target longitude and target latitude are created and spherical regridding is then performed on the gust variable by passing the target latitude and target longitude as arguments. The method also takes an argument
'linear'which specifies the type of regridding method to use. The description of theregridded_datais finally printed to show properties of all its constructs:
target_latitude = cf.DimensionCoordinate(
    data=cf.Data(np.linspace(34, 72, num=10), "degrees_north")
)
target_longitude = cf.DimensionCoordinate(
    data=cf.Data(np.linspace(-25, 45, num=10), "degrees_east")
)

lon_bounds = target_longitude.create_bounds()
lat_bounds = target_latitude.create_bounds()

target_longitude.set_bounds(lon_bounds)
target_latitude.set_bounds(lat_bounds)

regridded_data = gust.regrids((target_latitude, target_longitude), "linear")
regridded_data.dump()
-----------------------------------------------------------
Field: id%UM_m01s03i463_vn1006 (ncvar%UM_m01s03i463_vn1006)
-----------------------------------------------------------
Conventions = 'CF-1.10'
_FillValue = -1073741824.0
history = 'Converted from UM/PP by cf-python v3.15.0'
lbproc = '8192'
lbtim = '122'
long_name = 'WIND GUST'
runid = 'aaaaa'
source = 'UM vn1006'
stash_code = '3463'
submodel = '1'
um_stash_source = 'm01s03i463'

Data(time(8), latitude(10), longitude(10)) = [[[--, ..., 6.10885110153462]]]

Cell Method: time(8): maximum

Domain Axis: height(1)
Domain Axis: latitude(10)
Domain Axis: longitude(10)
Domain Axis: time(8)

Dimension coordinate: time
    axis = 'T'
    calendar = '360_day'
    standard_name = 'time'
    units = 'days since 2051-1-1'
    Data(time(8)) = [2051-04-14 01:30:00, ..., 2051-04-14 22:30:00] 360_day
    Bounds:calendar = '360_day'
    Bounds:units = 'days since 2051-1-1'
    Bounds:Data(time(8), 2) = [[2051-04-14 00:00:00, ..., 2051-04-15 00:00:00]] 360_day

Dimension coordinate: height
    axis = 'Z'
    positive = 'up'
    standard_name = 'height'
    units = 'm'
    Data(height(1)) = [-1.0] m

Dimension coordinate: latitude
    standard_name = 'latitude'
    units = 'degrees_north'
    Data(latitude(10)) = [34.0, ..., 72.0] degrees_north
    Bounds:units = 'degrees_north'
    Bounds:Data(latitude(10), 2) = [[31.88888888888889, ..., 74.11111111111111]] degrees_north

Dimension coordinate: longitude
    standard_name = 'longitude'
    units = 'degrees_east'
    Data(longitude(10)) = [-25.0, ..., 45.0] degrees_east
    Bounds:units = 'degrees_east'
    Bounds:Data(longitude(10), 2) = [[-28.88888888888889, ..., 48.888888888888886]] degrees_east
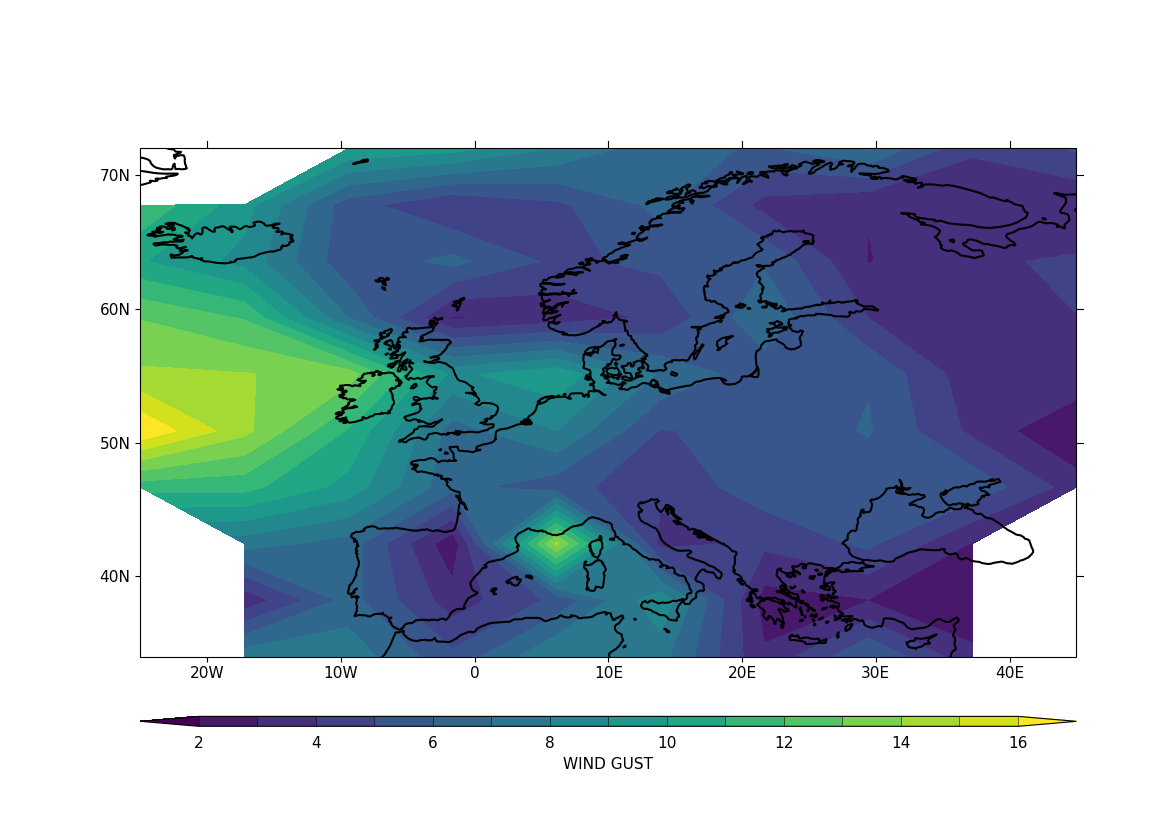
Step 6 is similarly repeated for the
regridded_datato plot the wind gust on a regular latitude-longitude domain:
cfp.mapset(resolution="50m")
cfp.con(regridded_data.subspace(T=test), lines=False)
/home/sadie/anaconda3/envs/cf-env/lib/python3.8/site-packages/cartopy/mpl/geoaxes.py:1586: UserWarning: The following kwargs were not used by contour: 'transform_first'
  result = matplotlib.axes.Axes.contourf(self, *args, **kwargs)
Total running time of the script: ( 0 minutes 23.559 seconds)