Note
Click here to download the full example code
Calculating global mean temperature timeseries
In this recipe we will calculate and plot monthly and annual global mean temperature timeseries.
Import cf-python and cf-plot:
import cfplot as cfp

import cf
Read the field constructs:
[<CF Field: ncvar%stn(long_name=time(1452), long_name=latitude(360), long_name=longitude(720))>,
 <CF Field: long_name=near-surface temperature(long_name=time(1452), long_name=latitude(360), long_name=longitude(720)) degrees Celsius>]
Select near surface temperature by index and look at its contents:
Field: long_name=near-surface temperature (ncvar%tmp)
-----------------------------------------------------
Data            : long_name=near-surface temperature(long_name=time(1452), long_name=latitude(360), long_name=longitude(720)) degrees Celsius
Dimension coords: long_name=time(1452) = [1901-01-16 00:00:00, ..., 2021-12-16 00:00:00] gregorian
                : long_name=latitude(360) = [-89.75, ..., 89.75] degrees_north
                : long_name=longitude(720) = [-179.75, ..., 179.75] degrees_east
Select latitude and longitude dimensions by identities, with two different techniques:
lon = temp.coordinate("long_name=longitude")
lat = temp.coordinate("Y")
Print the description of near surface temperature using the dump method to show properties of all constructs:
-----------------------------------------------------
Field: long_name=near-surface temperature (ncvar%tmp)
-----------------------------------------------------
Conventions = 'CF-1.4'
_FillValue = 9.96921e+36
comment = 'Access to these data is available to any registered CEDA user.'
contact = 'support@ceda.ac.uk'
correlation_decay_distance = 1200.0
history = 'Fri 29 Apr 14:35:01 BST 2022 : User f098 : Program makegridsauto.for
           called by update.for'
institution = 'Data held at British Atmospheric Data Centre, RAL, UK.'
long_name = 'near-surface temperature'
missing_value = 9.96921e+36
references = 'Information on the data is available at
              http://badc.nerc.ac.uk/data/cru/'
source = 'Run ID = 2204291347. Data generated from:tmp.2204291209.dtb'
title = 'CRU TS4.06 Mean Temperature'
units = 'degrees Celsius'

Data(long_name=time(1452), long_name=latitude(360), long_name=longitude(720)) = [[[--, ..., --]]] degrees Celsius

Domain Axis: long_name=latitude(360)
Domain Axis: long_name=longitude(720)
Domain Axis: long_name=time(1452)

Dimension coordinate: long_name=time
    calendar = 'gregorian'
    long_name = 'time'
    units = 'days since 1900-1-1'
    Data(long_name=time(1452)) = [1901-01-16 00:00:00, ..., 2021-12-16 00:00:00] gregorian

Dimension coordinate: long_name=latitude
    long_name = 'latitude'
    units = 'degrees_north'
    Data(long_name=latitude(360)) = [-89.75, ..., 89.75] degrees_north

Dimension coordinate: long_name=longitude
    long_name = 'longitude'
    units = 'degrees_east'
    Data(long_name=longitude(720)) = [-179.75, ..., 179.75] degrees_east
Latitude and longitude dimension coordinate cell bounds are absent, which are created and set:
a = lat.create_bounds()
lat.set_bounds(a)
lat.dump()
Dimension coordinate: long_name=latitude
    long_name = 'latitude'
    units = 'degrees_north'
    Data(360) = [-89.75, ..., 89.75] degrees_north
    Bounds:units = 'degrees_north'
    Bounds:Data(360, 2) = [[-90.0, ..., 90.0]] degrees_north
b = lon.create_bounds()
lon.set_bounds(b)
lon.dump()
Dimension coordinate: long_name=longitude
    long_name = 'longitude'
    units = 'degrees_east'
    Data(720) = [-179.75, ..., 179.75] degrees_east
    Bounds:units = 'degrees_east'
    Bounds:Data(720, 2) = [[-180.0, ..., 180.0]] degrees_east
print(b.array)
[[-180.  -179.5]
 [-179.5 -179. ]
 [-179.  -178.5]
 ...
 [ 178.5  179. ]
 [ 179.   179.5]
 [ 179.5  180. ]]
Time dimension coordinate cell bounds are similarly created and set for cell sizes of one calendar month:
time = temp.coordinate("long_name=time")
c = time.create_bounds(cellsize=cf.M())
time.set_bounds(c)
time.dump()
Dimension coordinate: long_name=time
    calendar = 'gregorian'
    long_name = 'time'
    units = 'days since 1900-1-1'
    Data(1452) = [1901-01-16 00:00:00, ..., 2021-12-16 00:00:00] gregorian
    Bounds:calendar = 'gregorian'
    Bounds:units = 'days since 1900-1-1'
    Bounds:Data(1452, 2) = [[1901-01-01 00:00:00, ..., 2022-01-01 00:00:00]] gregorian
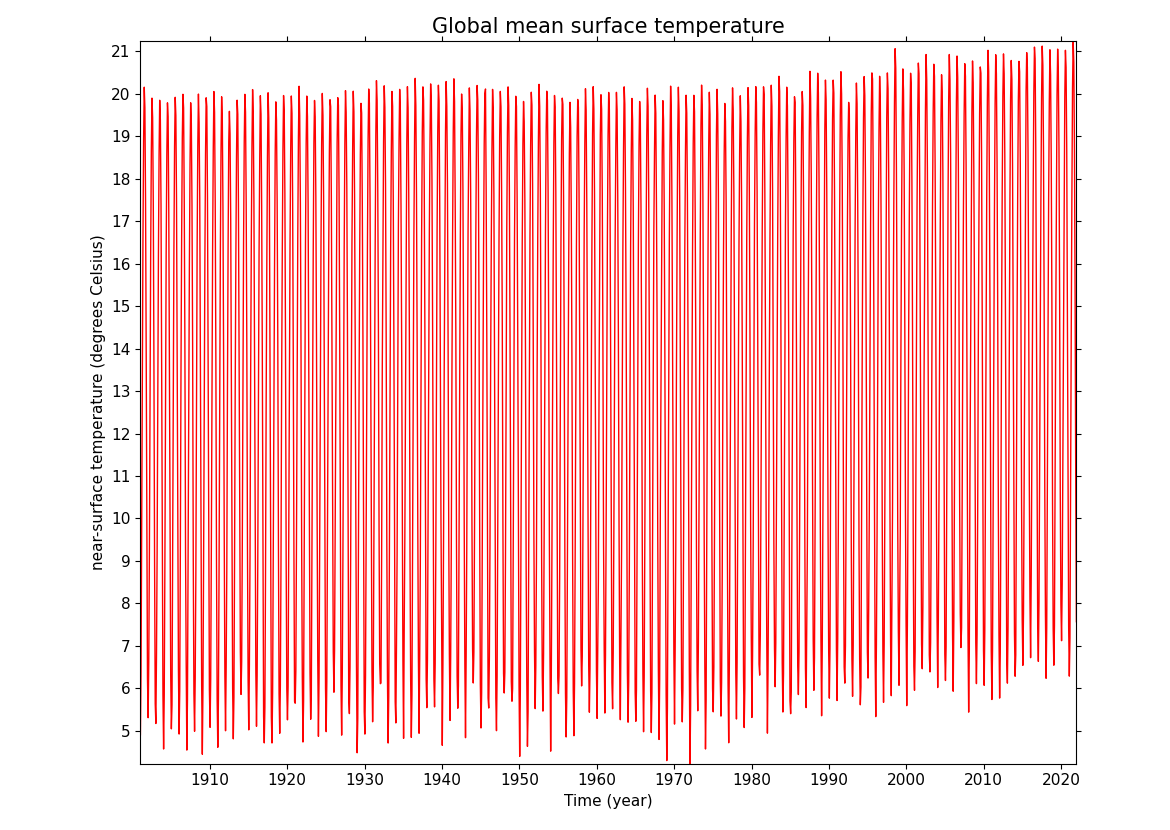
Calculate and plot the area weighted mean surface temperature for each time:
global_avg = temp.collapse("area: mean", weights=True)
cfp.lineplot(global_avg, color="red", title="Global mean surface temperature")
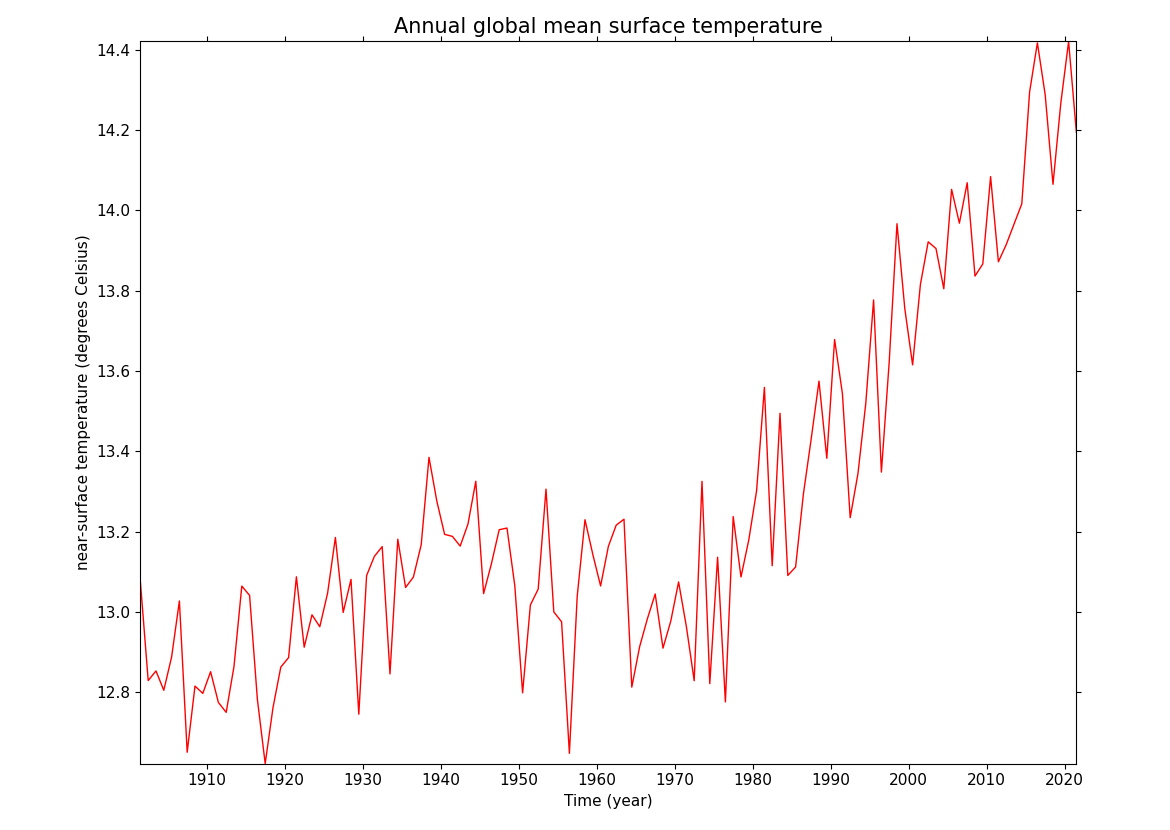
Calculate and plot the annual global mean surface temperature:
annual_global_avg = global_avg.collapse("T: mean", group=cf.Y())
cfp.lineplot(
    annual_global_avg,
    color="red",
    title="Annual global mean surface temperature",
)
Total running time of the script: ( 1 minutes 17.579 seconds)