Note
Click here to download the full example code
Plotting wind vectors overlaid on precipitation data
In this recipe we will plot wind vectors, derived from northward and eastward wind components, over precipitation data.
Import cf-python and cf-plot:
import cfplot as cfp

import cf
Read the field constructs:
[<CF Field: northward_wind(time(1980), latitude(144), longitude(192)) m s-1>]
[<CF Field: eastward_wind(time(1980), latitude(144), longitude(192)) m s-1>]
[<CF Field: long_name=precipitation(long_name=time(1452), latitude(144), longitude(192)) mm/month>]
Select wind vectors and precipitation data by index and look at their contents:
Field: northward_wind (ncvar%vas)
---------------------------------
Data            : northward_wind(time(1980), latitude(144), longitude(192)) m s-1
Cell methods    : area: time(1980): mean
Dimension coords: time(1980) = [1850-01-16 00:00:00, ..., 2014-12-16 00:00:00] 360_day
                : latitude(144) = [-89.375, ..., 89.375] degrees_north
                : longitude(192) = [0.0, ..., 358.125] degrees_east
                : height(1) = [10.0] m
Field: eastward_wind (ncvar%uas)
--------------------------------
Data            : eastward_wind(time(1980), latitude(144), longitude(192)) m s-1
Cell methods    : area: time(1980): mean
Dimension coords: time(1980) = [1850-01-16 00:00:00, ..., 2014-12-16 00:00:00] 360_day
                : latitude(144) = [-89.375, ..., 89.375] degrees_north
                : longitude(192) = [0.0, ..., 358.125] degrees_east
                : height(1) = [10.0] m
Field: long_name=precipitation (ncvar%pre)
------------------------------------------
Data            : long_name=precipitation(long_name=time(1452), latitude(144), longitude(192)) mm/month
Dimension coords: long_name=time(1452) = [1901-01-16 00:00:00, ..., 2021-12-16 00:00:00] gregorian
                : latitude(144) = [-89.375, ..., 89.375] degrees_north
                : longitude(192) = [0.0, ..., 358.125] degrees_east
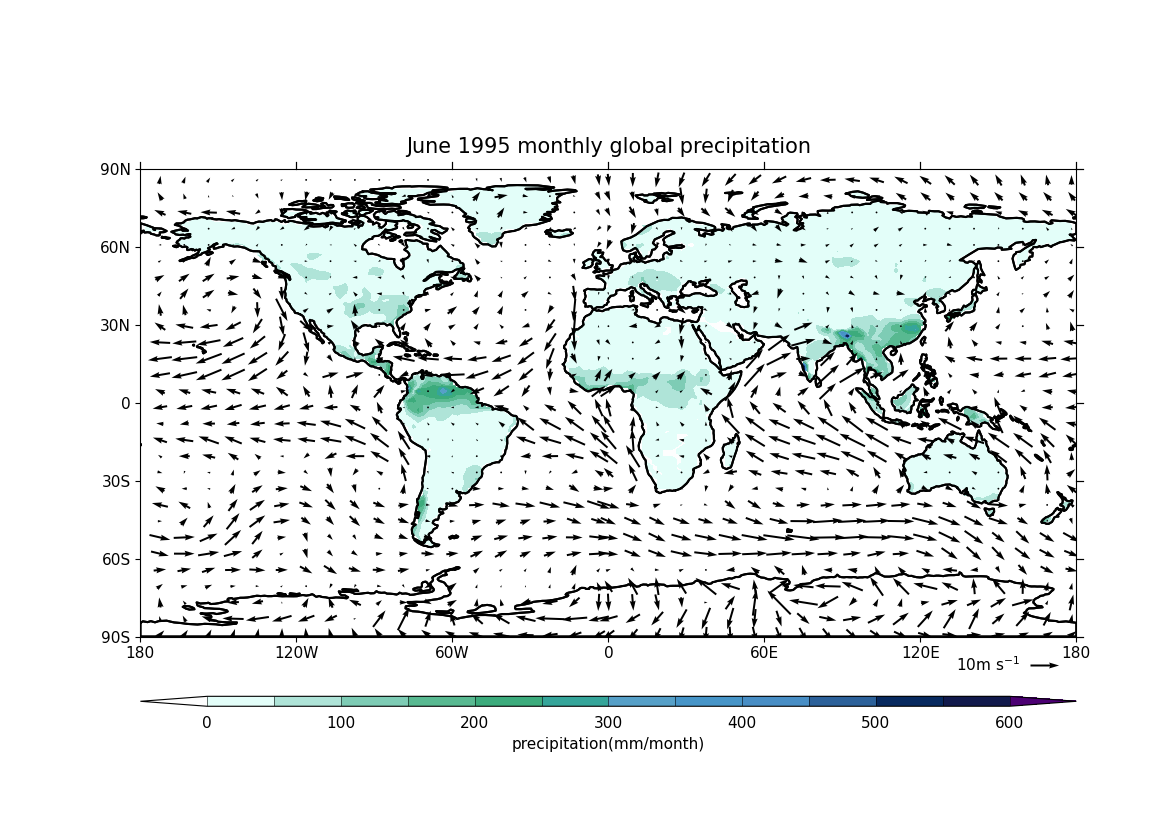
Plot the wind vectors on top of precipitation data for June 1995 by creating a subspace with a date-time object and using cfplot.con. Here cfplot.gopen is used to define the parts of the plot area, which is closed by cfplot.gclose; cfplot.cscale is used to choose one of the colour maps amongst many available; cfplot.levs is used to set the contour levels for precipitation data; and cfplot.vect is used to plot the wind vectors for June 1995:
june_95 = cf.year(1995) & cf.month(6)
cfp.gopen()
cfp.cscale("precip4_11lev")
cfp.levs(step=100)
cfp.con(
    pre.subspace(T=june_95),
    lines=False,
    title="June 1995 monthly global precipitation",
)
cfp.vect(
    u=u.subspace(T=june_95),
    v=v.subspace(T=june_95),
    key_length=10,
    scale=35,
    stride=5,
)
cfp.gclose()
Total running time of the script: ( 0 minutes 6.238 seconds)