Hovmöller plots#
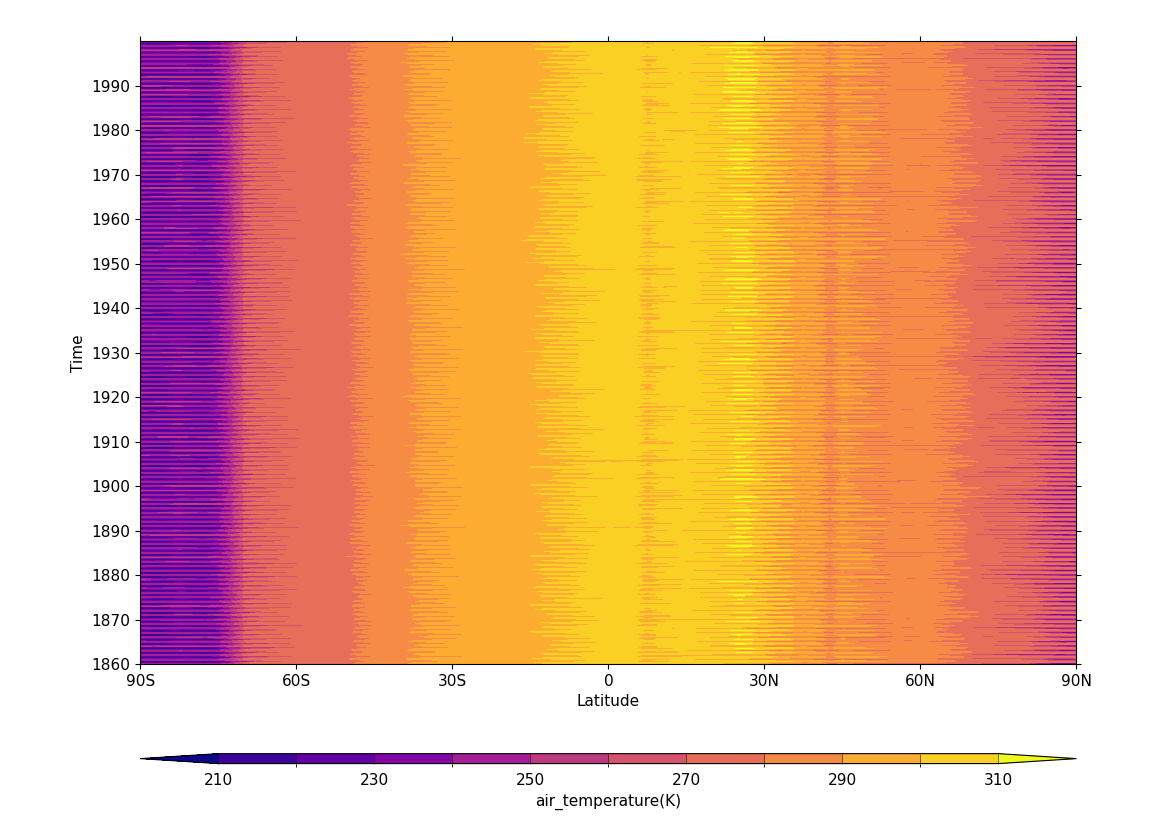
Example 10: Latitude-time Hovmöller plot#
Making a Hovmöller plot with latitude and time as the axes#
f = cf.read(f"cfplot_data/tas_A1.nc")[0]

cfp.cscale("plasma")

cfp.con(f.subspace(longitude=0), lines=0)
Example 11: Latitude-time subset view Hovmöller plot#
Making a Hovmöller plot with latitude and time as the axes
where the plot is set to display only a subset of the
latitude axes#
f = cf.read(f"cfplot_data/tas_A1.nc")[0]

cfp.gset(-30, 30, "1960-1-1", "1980-1-1")
cfp.levs(min=280, max=305, step=1)
cfp.cscale("plasma")

cfp.con(f.subspace(longitude=0), lines=0)
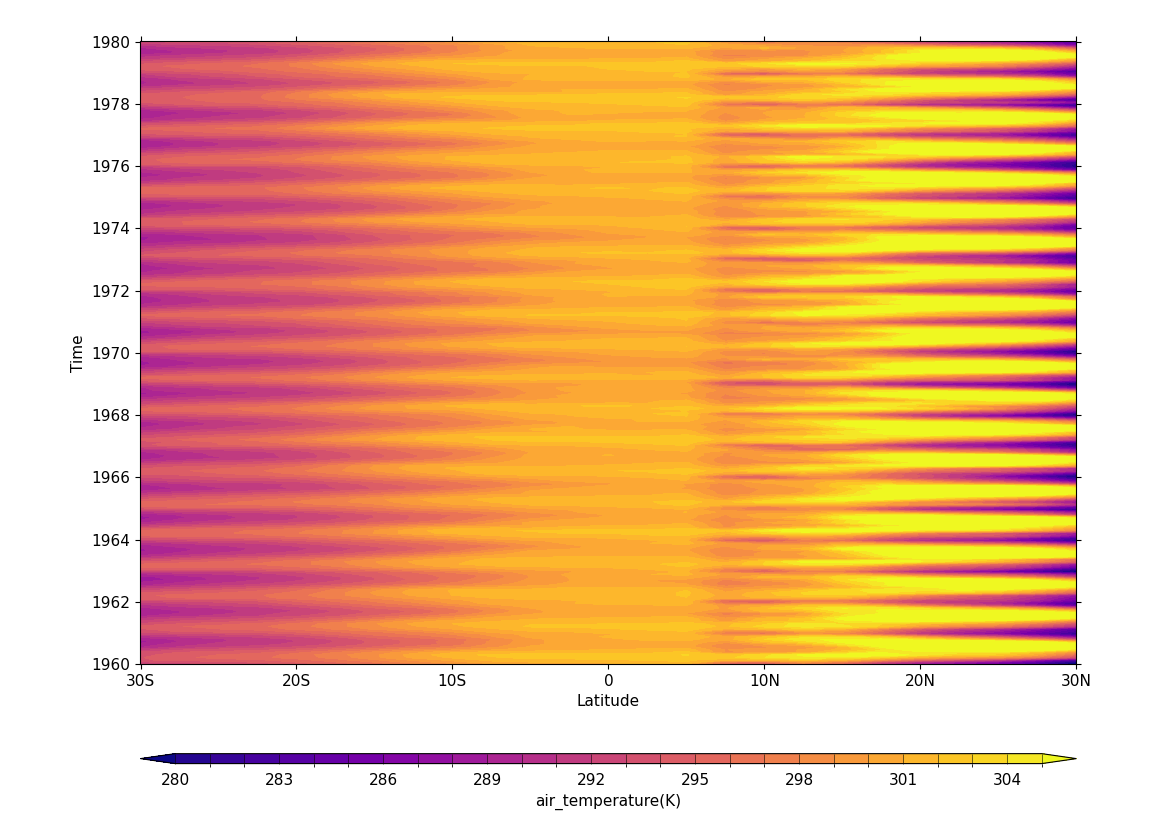
Note that when using cfp.gset the correct date format is YYYY-MM-DD or YYYY-MM-DD HH:MM:SS. Anything else will give unexpected results.
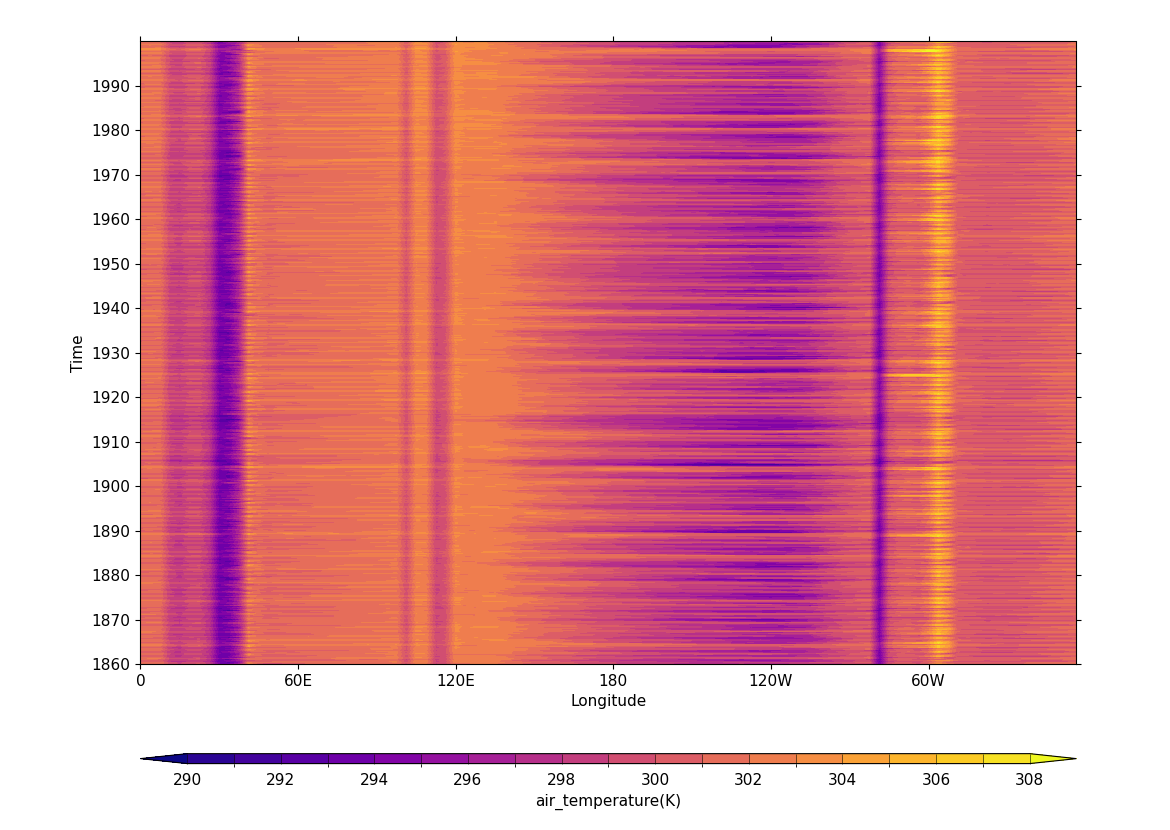
Example 12: Longitude-time Hovmöller plot#
Making a Hovmöller plot with longitude and time as the axes#
f = cf.read(f"cfplot_data/tas_A1.nc")[0]

cfp.cscale("plasma")

cfp.con(f.subspace(latitude=0), lines=0)