User-defined axes#
Some plots may need to be re-labelled to avoid overly dense or sparse labels. The following pair of examples illustrate the 'before and after' of this case.
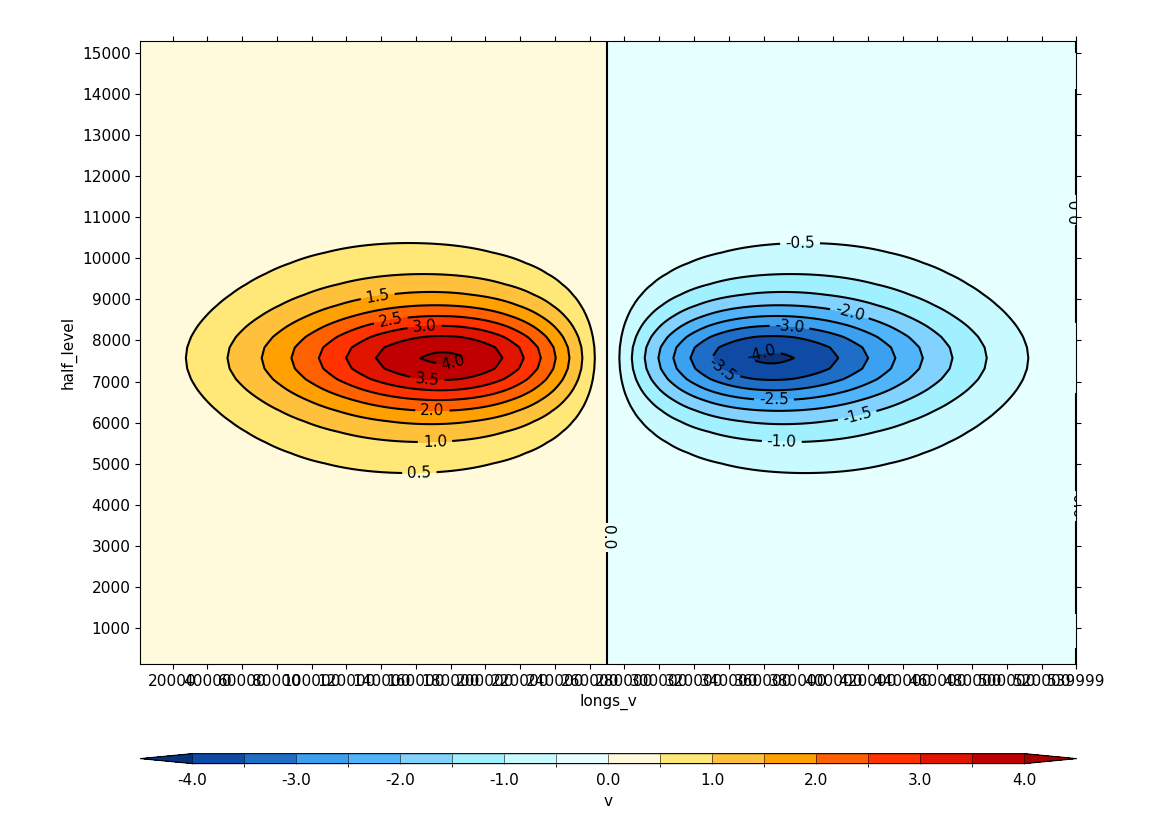
Example 20: Case where user-defined axis labels are required#
A case where a default plot has an axis with labels
that are too dense and overlap, such that user-defined
axis labels are required (see Example 21)#
fl = cf.read(f"{self.data_dir}/Geostropic_Adjustment.nc")
f = fl.select_by_identity("ncvar%v")[0]

cfp.con(f.subspace[9])
Example 21a: User-defined axes#
Adjusting the default axes labelling to prevent overlapping
labels#
fl = cf.read(f"{self.data_dir}/Geostropic_Adjustment.nc")
f = fl.select_by_identity("ncvar%v")[0]

cfp.con(
    f.subspace[9],
    title="test data",
    xticks=np.arange(5) * 100000 + 100000,
    yticks=np.arange(7) * 2000 + 2000,
    xlabel="x-axis",
    ylabel="z-axis",
)
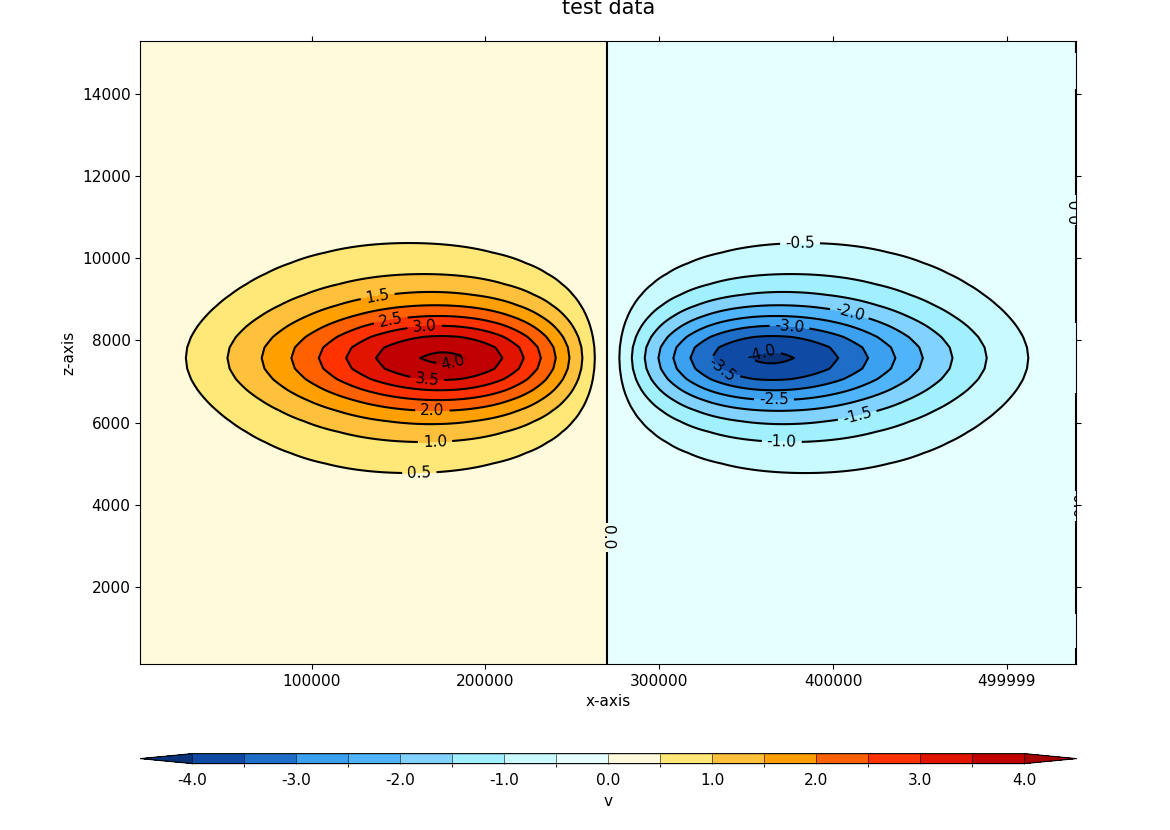
In this plot the axes are labelled with the axes keyword before
making a contour map of the data. The xticklabels and yticklabels
options can be used to fine tune the axis labels.