Plots of latitude/longitude against pressure#
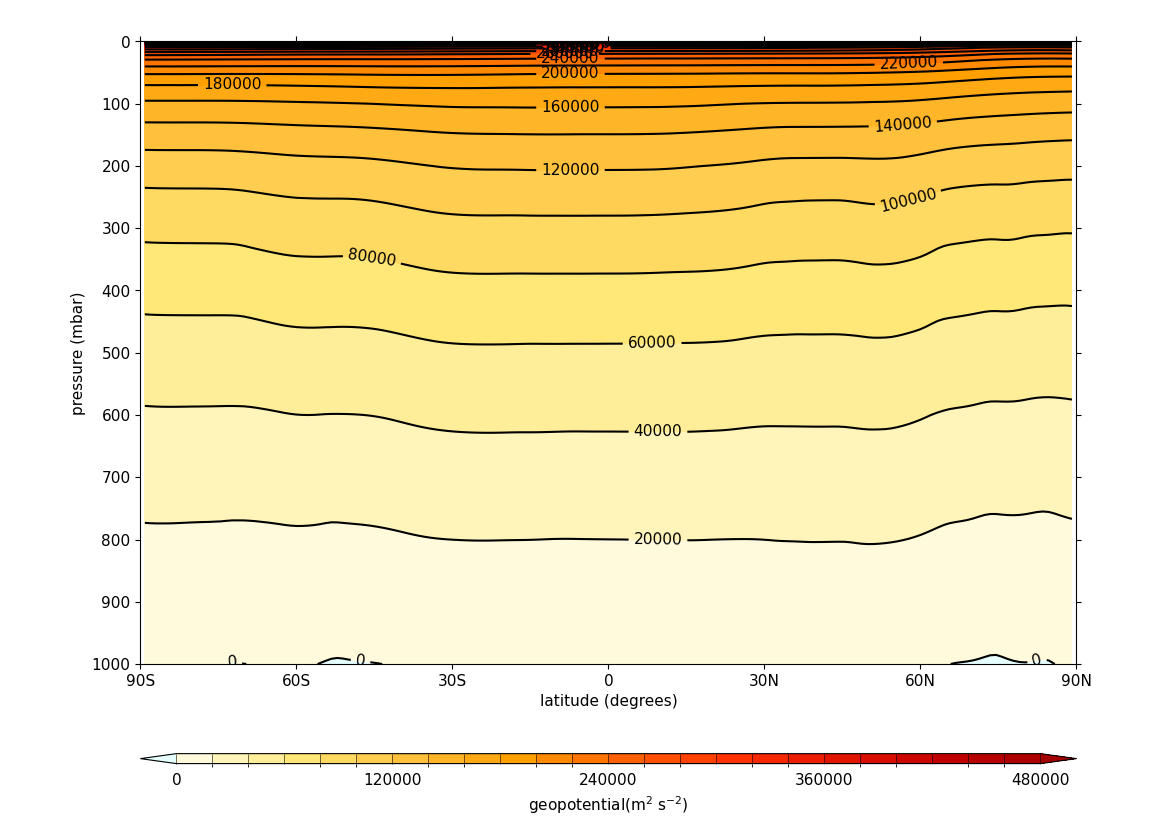
Example 6: Latitude-pressure plot at set longitude#
Making a plot for a given longitude value with latitude and
pressure as the axes#
fl = cf.read(f"{self.data_dir}/ggap.nc")
f = fl.select_by_identity("geopotential")[0]

cfp.con(f.subspace(longitude=0))
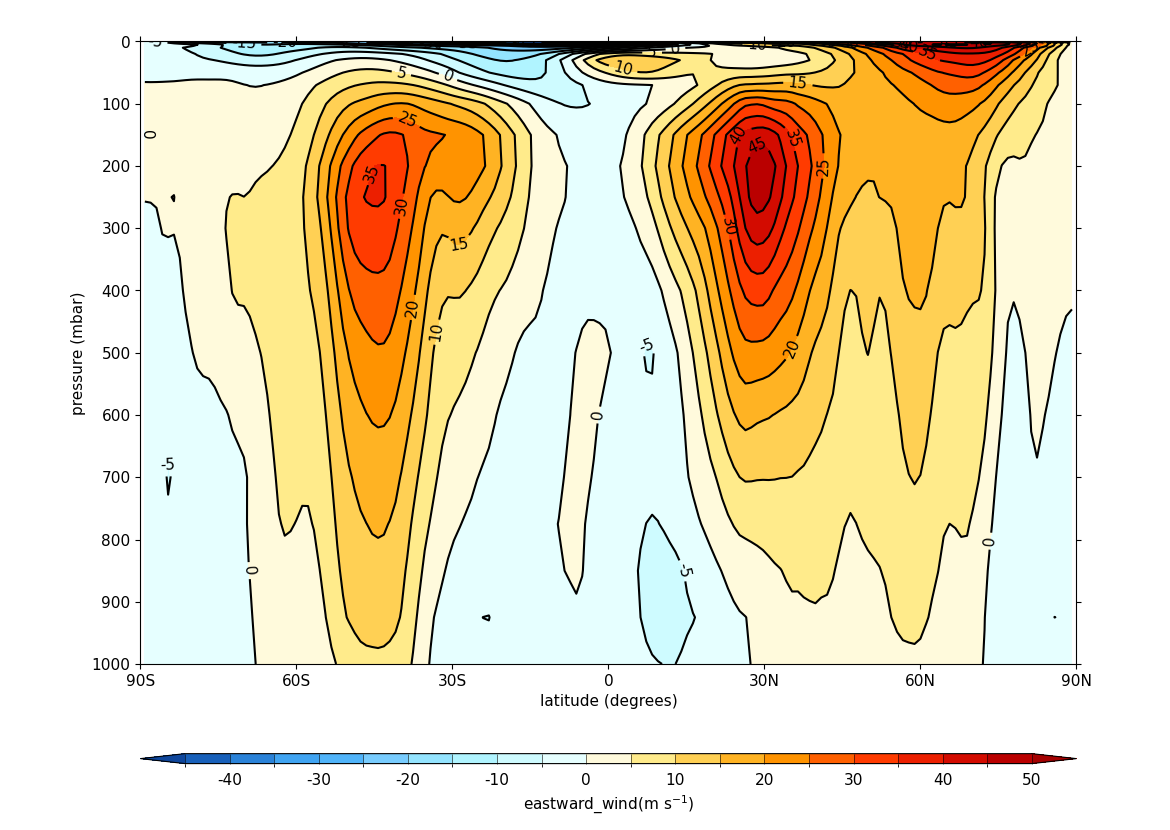
Example 7: Latitude-pressure plot over zonal mean#
Making a plot with latitude and pressure as the axes
for a zonal mean (mean over longitude)#
fl = cf.read(f"{self.data_dir}/ggap.nc")
f = fl.select_by_identity("eastward_wind")[0]

cfp.con(f.collapse("mean", "longitude"))
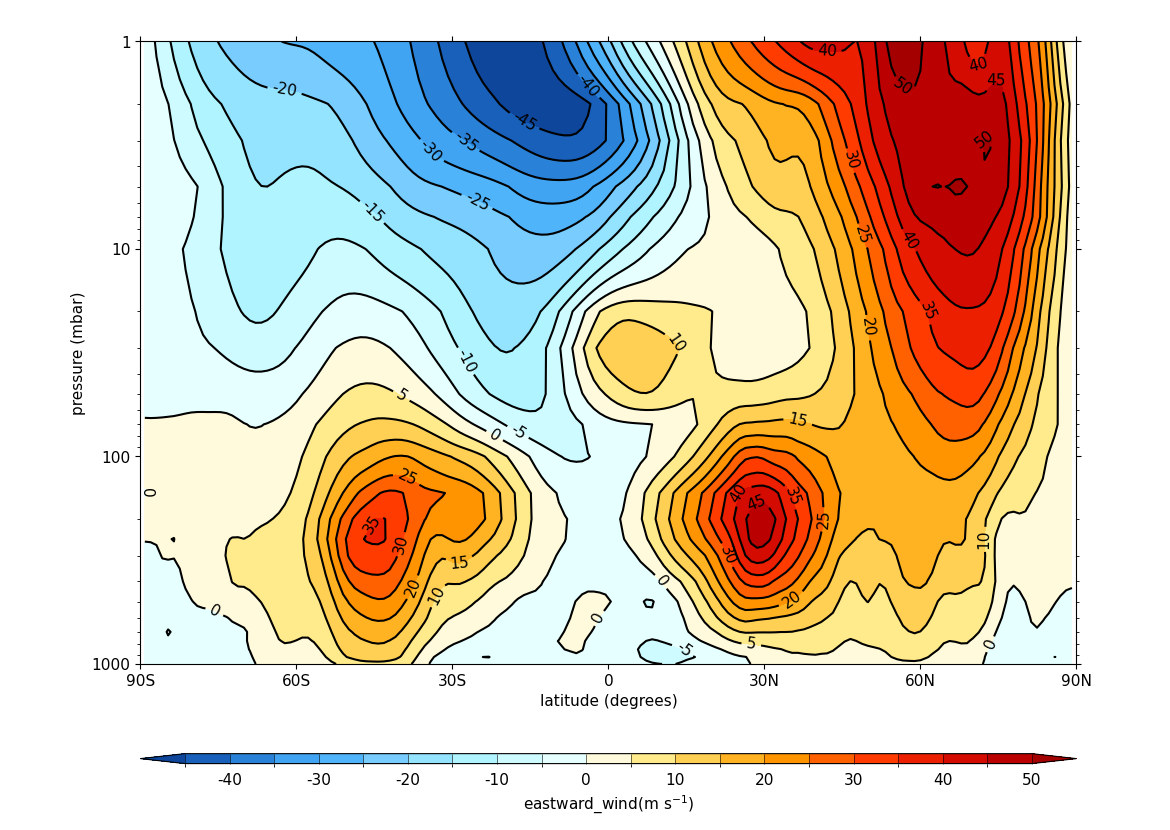
Example 8: Latitude against log of pressure over longitude zonal mean#
Making a semilog plot with latitude and the log of the
pressure as the axes for a zonal mean over longitude#
fl = cf.read(f"{self.data_dir}/ggap.nc")
f = fl.select_by_identity("eastward_wind")[0]

cfp.con(f.collapse("mean", "longitude"), ylog=1)
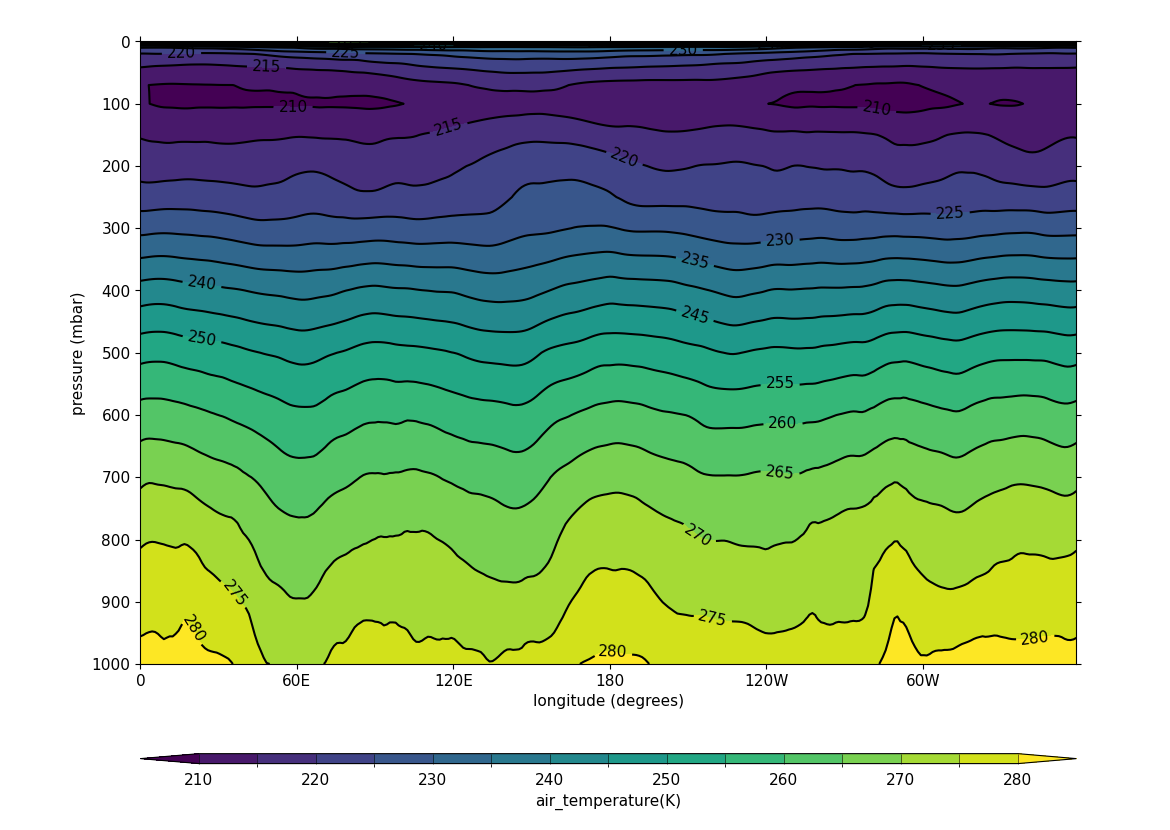
Example 9: Longitude-pressure plot over latitude mean#
Making a plot with longitude and pressure as the axes
for a mean over latitude#
fl = cf.read(f"{self.data_dir}/ggap.nc")
f = fl.select_by_identity("air_temperature")[0]

cfp.con(f.collapse("mean", "latitude"))