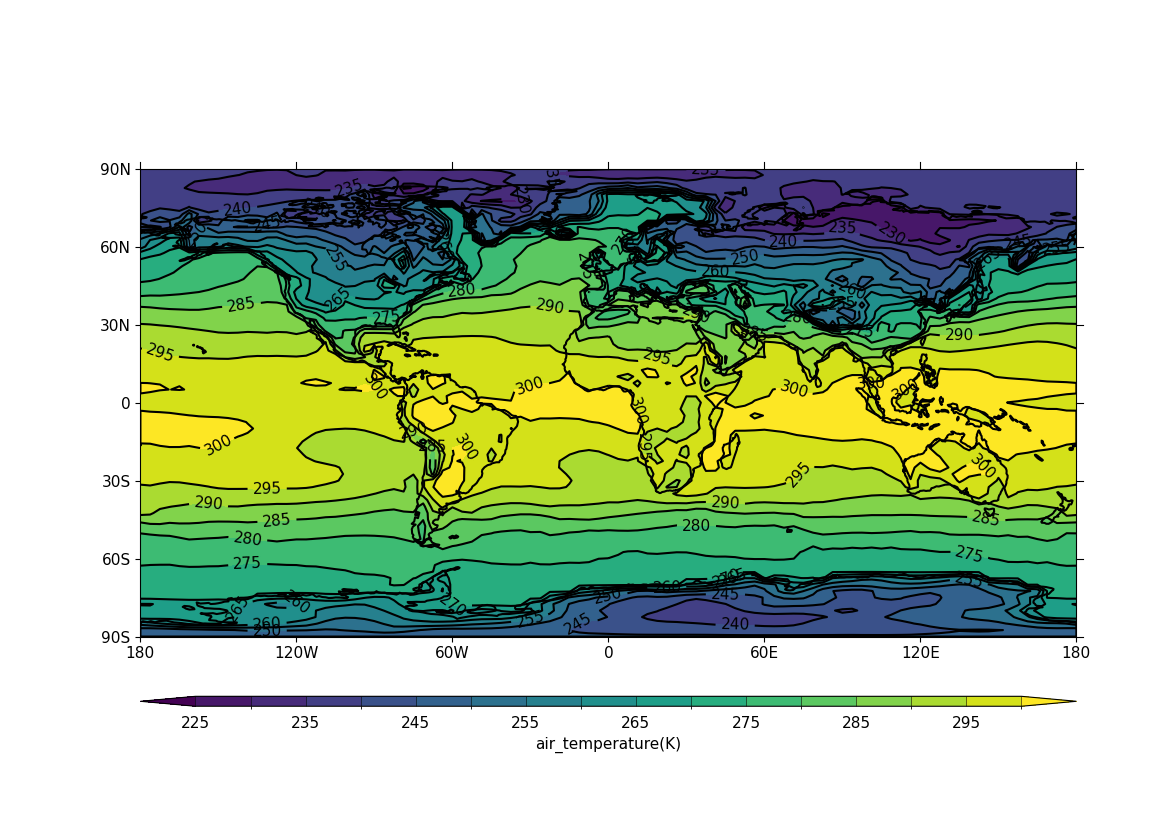
Example 1: Basic contour plot in default projection#
Making a basic default contour plot which uses the default
projection, Cylindrical, and has contour lines explicitly
filled and shown with value labels#
f = cf.read(f"cfplot_data/tas_A1.nc")[0]

cfp.con(f.subspace(time=15))