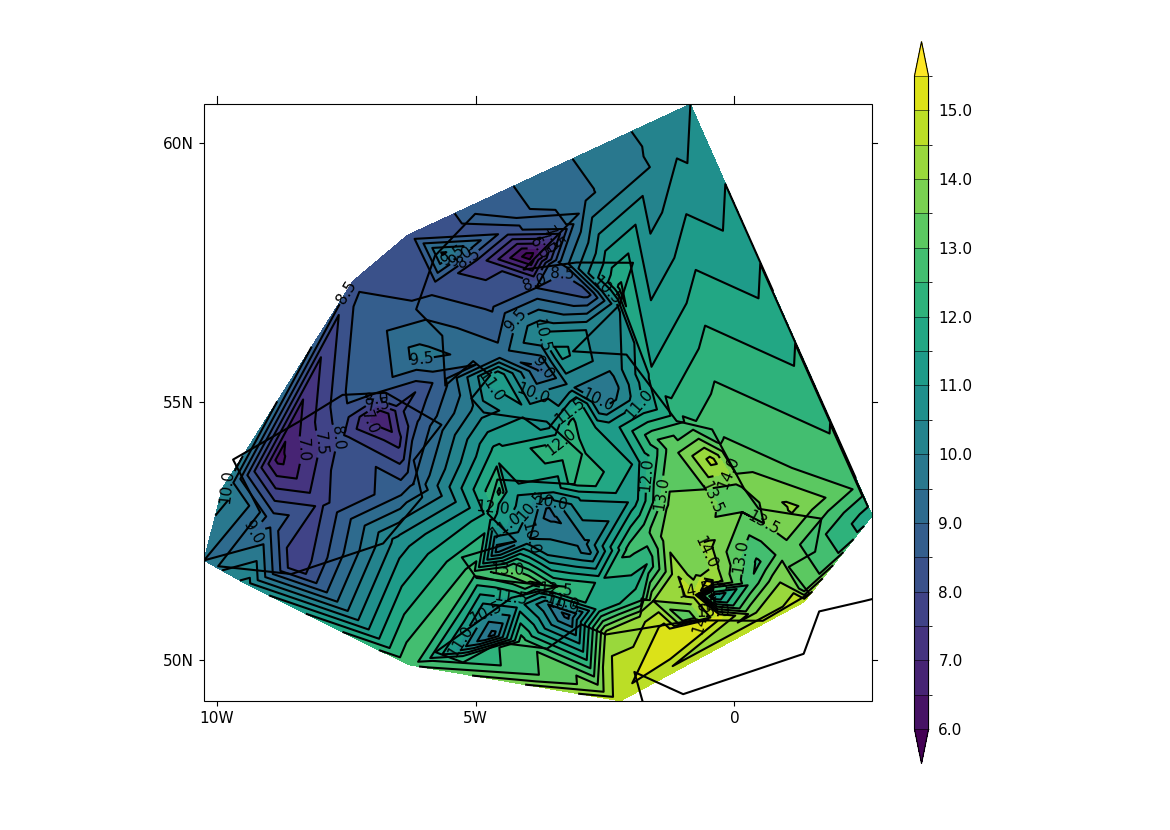
Example 26a: Contour plot based on discrete feature values#
Making a contour plot where the contours are determined
from discrete feature values, in this case station data#
# Arrays for data
lons = []
lats = []
pressure = []
temp = []

# Read data and make the contour plot
f = open("cfplot_data/synop_data.txt")
lines = f.readlines()
for line in lines:
    mysplit = line.split()
    lons = np.append(lons, float(mysplit[1]))
    lats = np.append(lats, float(mysplit[2]))
    pressure = np.append(pressure, float(mysplit[3]))
    temp = np.append(temp, float(mysplit[4]))

cfp.con(
    x=lons, y=lats, f=temp, ptype=1, colorbar_orientation="vertical"
)