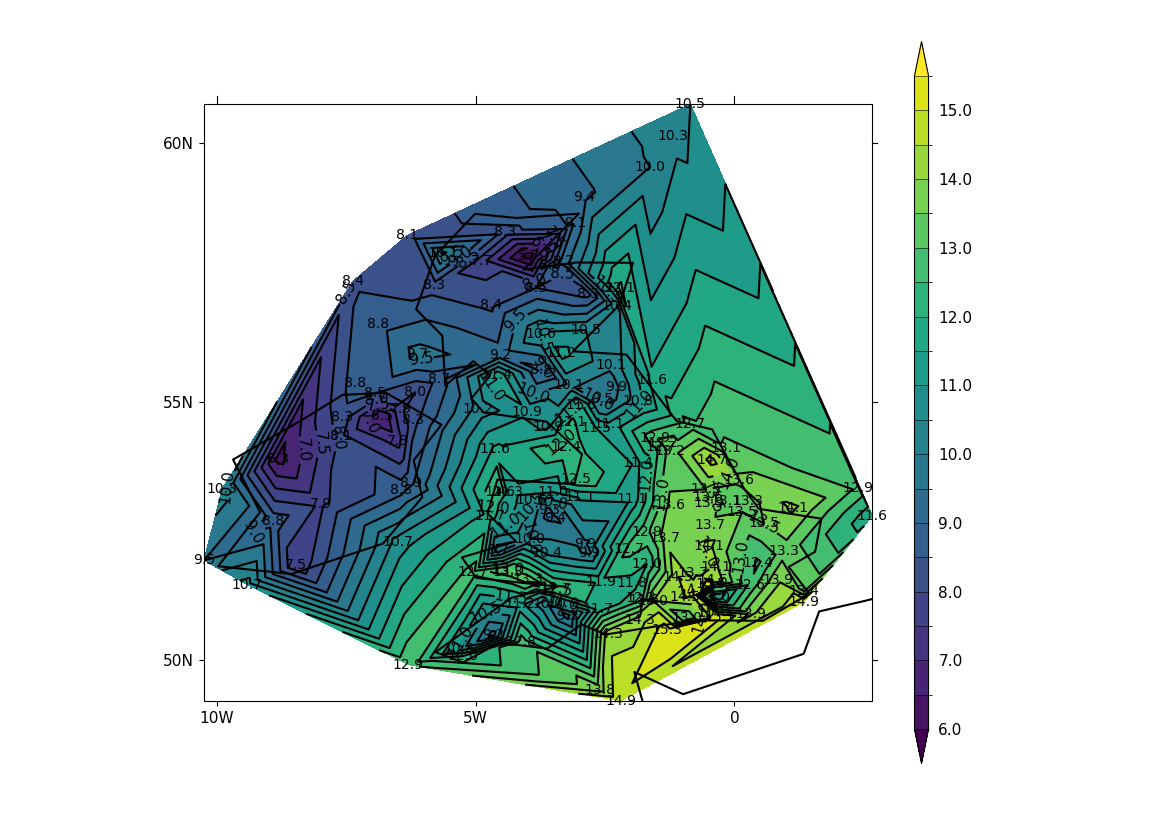
Example 26b: Contour plot from discrete feature values with labelling#
Making a contour plot where the contours are determined
from discrete feature values with labels to annotate the
values at each feature, in this case station data with
values at each station annotated#
# Arrays for data
lons = []
lats = []
pressure = []
temp = []

# Read data and make the contour plot
f = open("cfplot_data/synop_data.txt")
lines = f.readlines()
for line in lines:
    mysplit = line.split()
    lons = np.append(lons, float(mysplit[1]))
    lats = np.append(lats, float(mysplit[2]))
    pressure = np.append(pressure, float(mysplit[3]))
    temp = np.append(temp, float(mysplit[4]))

cfp.gopen()
cfp.con(
    x=lons, y=lats, f=temp, ptype=1, colorbar_orientation="vertical"
)
for i in np.arange(len(lines)):
    cfp.plotvars.mymap.text(
        float(lons[i]),
        float(lats[i]),
        str(temp[i]),
        horizontalalignment="center",
        verticalalignment="center",
        transform=ccrs.PlateCarree(),
    )

cfp.gclose()