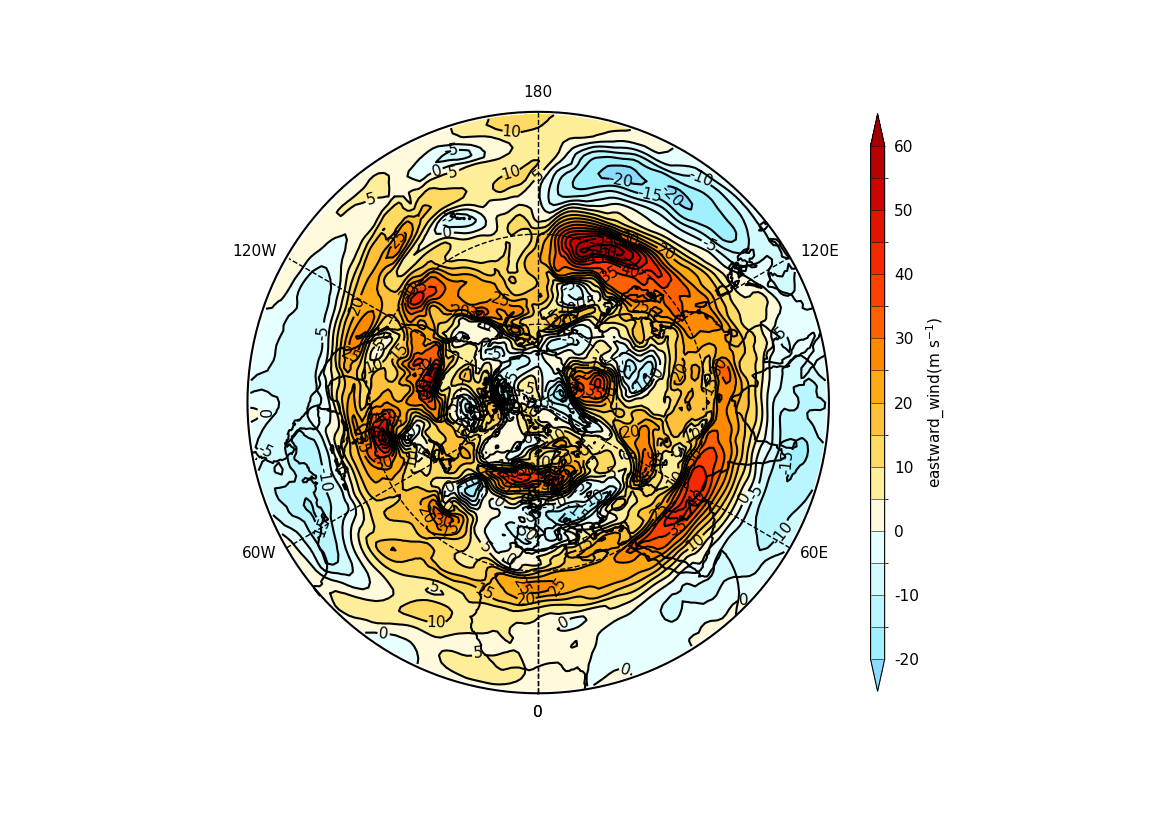
Example 4: North Pole polar stereographic projection contour plot#
Plotting a contour plot in the North Pole polar
stereographic projection#
fl = cf.read(f"{self.data_dir}/ggap.nc")
f = fl.select_by_identity("eastward_wind")[0]

cfp.mapset(proj="npstere")

cfp.con(f.subspace(pressure=500))