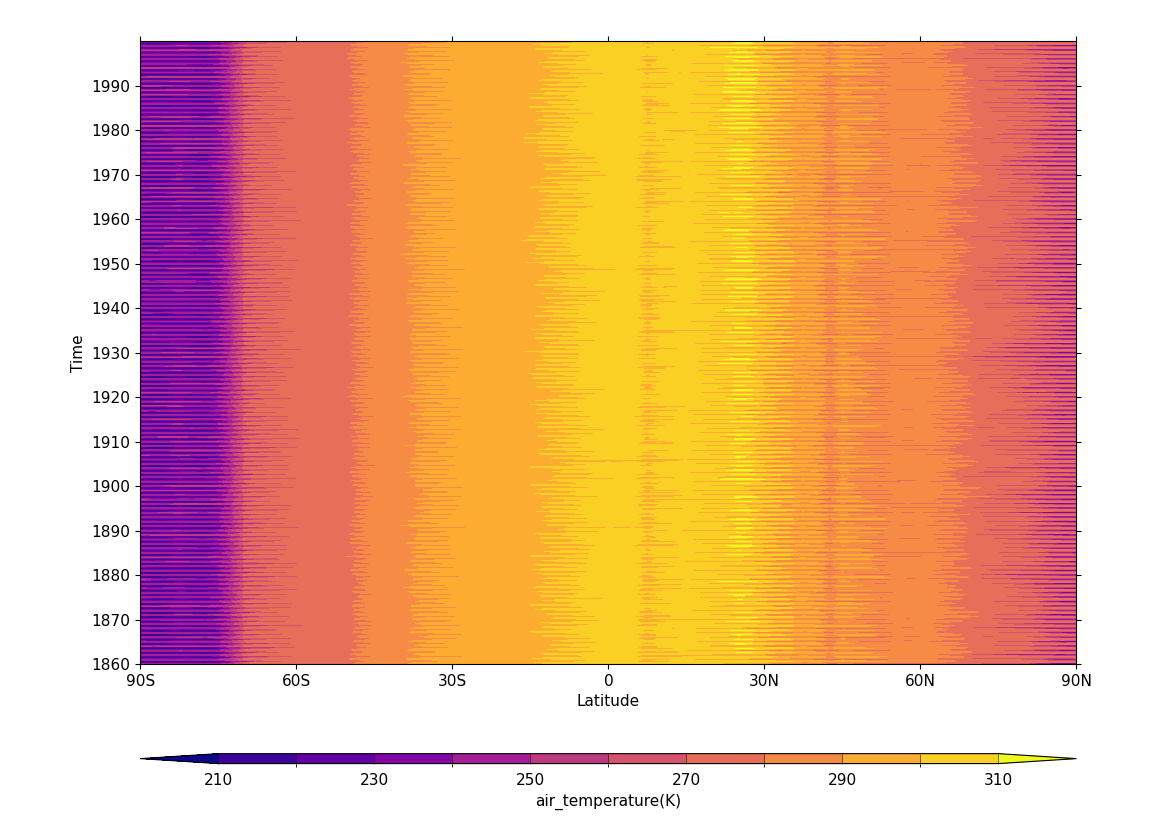
Example 10: Latitude-time Hovmöller plot# Making a Hovmöller plot with latitude and time as the axes# f = cf.read(f"cfplot_data/tas_A1.nc")[0] cfp.cscale("plasma") cfp.con(f.subspace(longitude=0), lines=0)