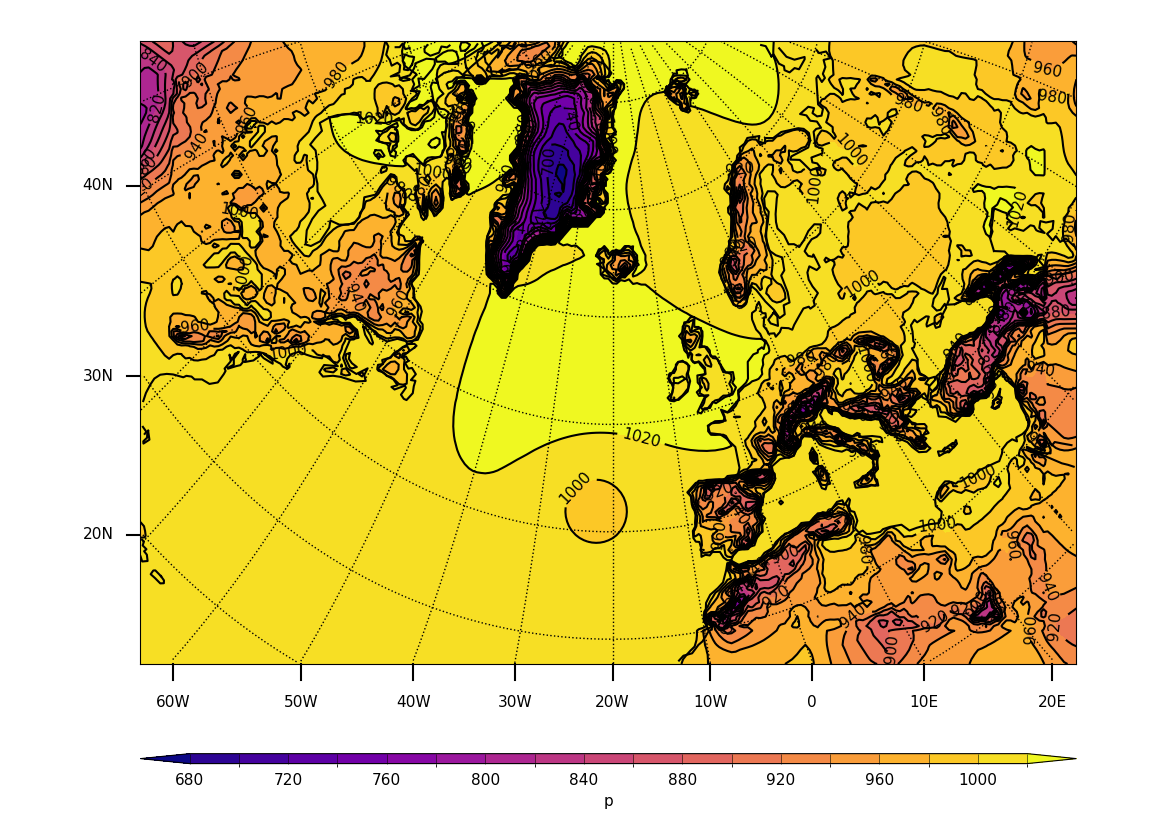
Example 22: Plot of rotated pole data on its native grid#
Making a plot of data defined on a rotated pole coordinate
system shown on its native grid#
f = cf.read(f"cfplot_data/rgp.nc")[0]

cfp.cscale("plasma")
cfp.mapset(proj="rotated")

cfp.con(f)