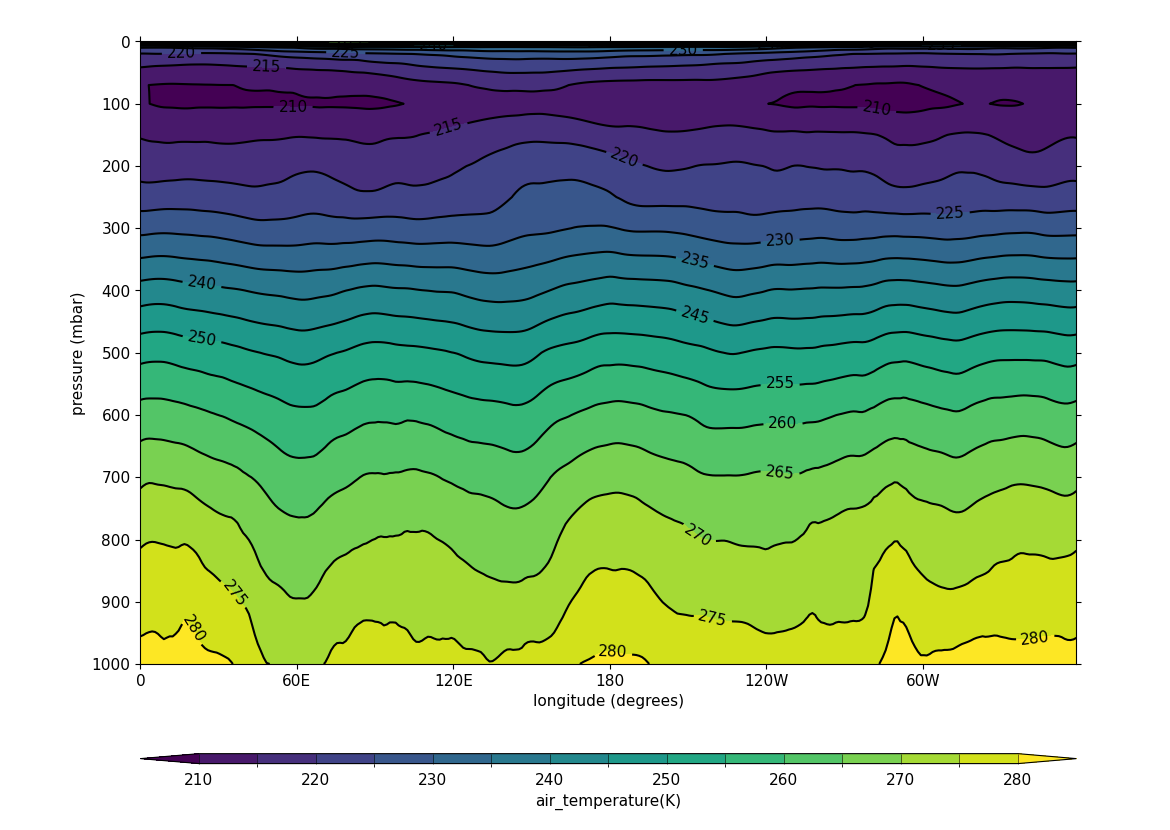
Example 9: Longitude-pressure plot over latitude mean#
Making a plot with longitude and pressure as the axes
for a mean over latitude#
fl = cf.read(f"{self.data_dir}/ggap.nc")
f = fl.select_by_identity("air_temperature")[0]

cfp.con(f.collapse("mean", "latitude"))