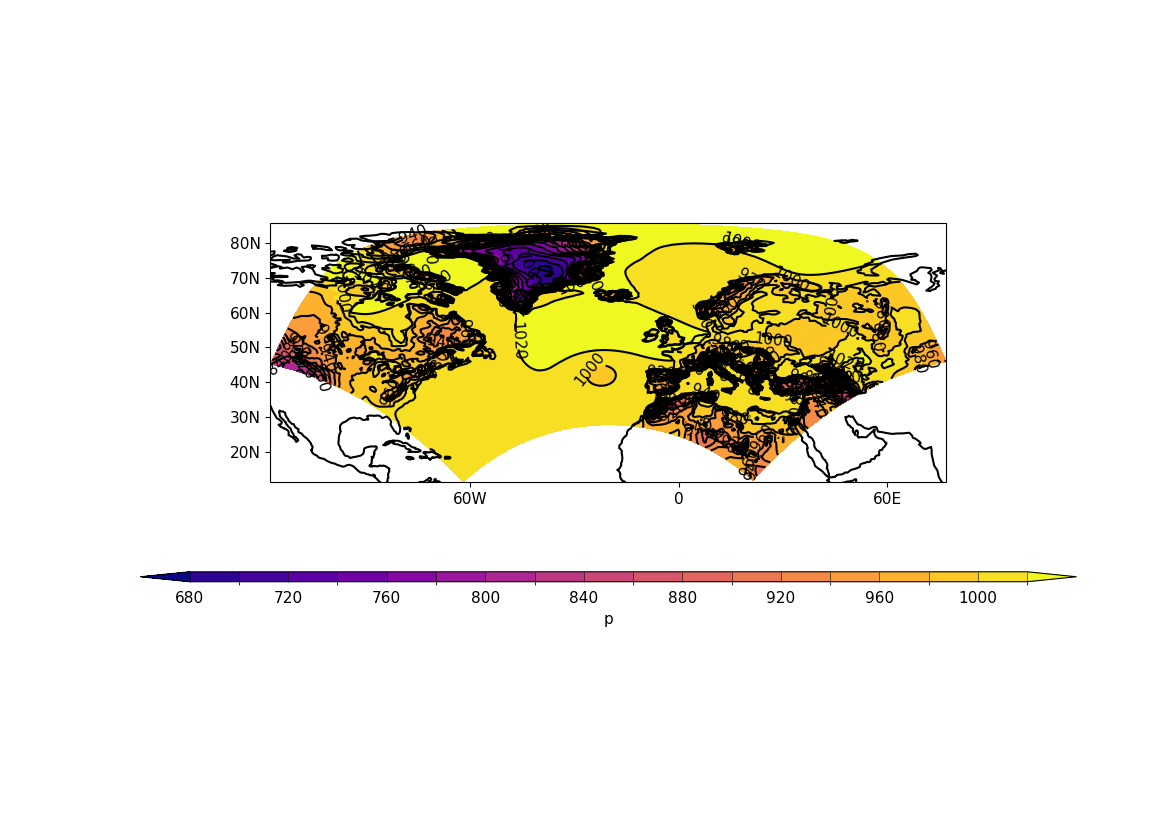
Example 21b: Plot of rotated pole data# Making a plot of data defined on a rotated pole coordinate system# f = cf.read(f"cfplot_data/rgp.nc")[0] cfp.cscale("plasma") cfp.con(f)