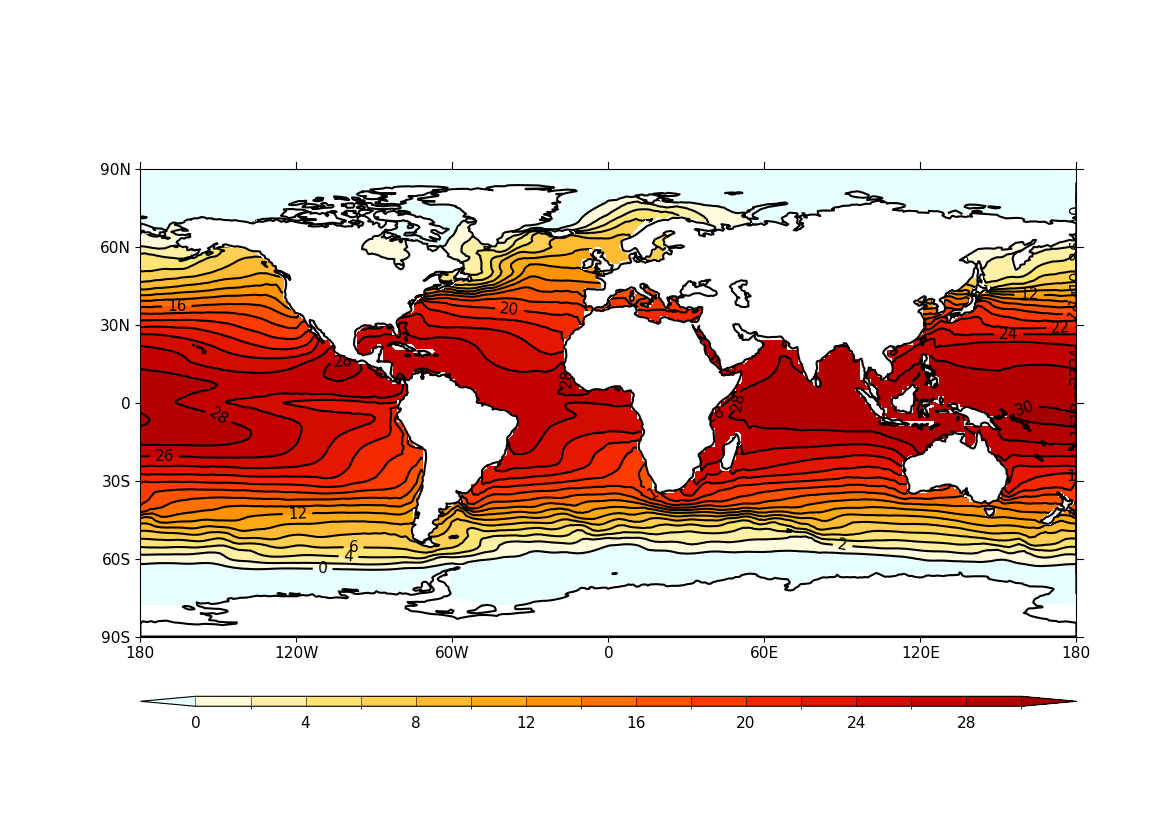
Example 25: UGRID contour plot with ORCA 2 output#
Making a contour plot of UGRID data, specifically ORCA 2
ocean-only grid data#
f = cf.read(f"cfplot_data/orca2.nc")

# Get an Orca grid and flatten the arrays
lons = f.select_by_identity("ncvar%longitude")[0]
lats = f.select_by_identity("ncvar%latitude")[0]
temp = f.select_by_identity("ncvar%sst")[0]

lons.flatten(inplace=True)
lats.flatten(inplace=True)
temp.flatten(inplace=True)

# Note: in this case we can't input the 'temp' field as-is,
# because it isn't CF-compliant, notably it doesn't have
# coordinates of any kind set. So we must pull out the array
# and input that, along with the corresponding lat and lon arrays.
cfp.con(f=temp.array, x=lons.array, y=lats.array, ptype=1)