Example 19b: Multiple plots with user-specified plot positions#
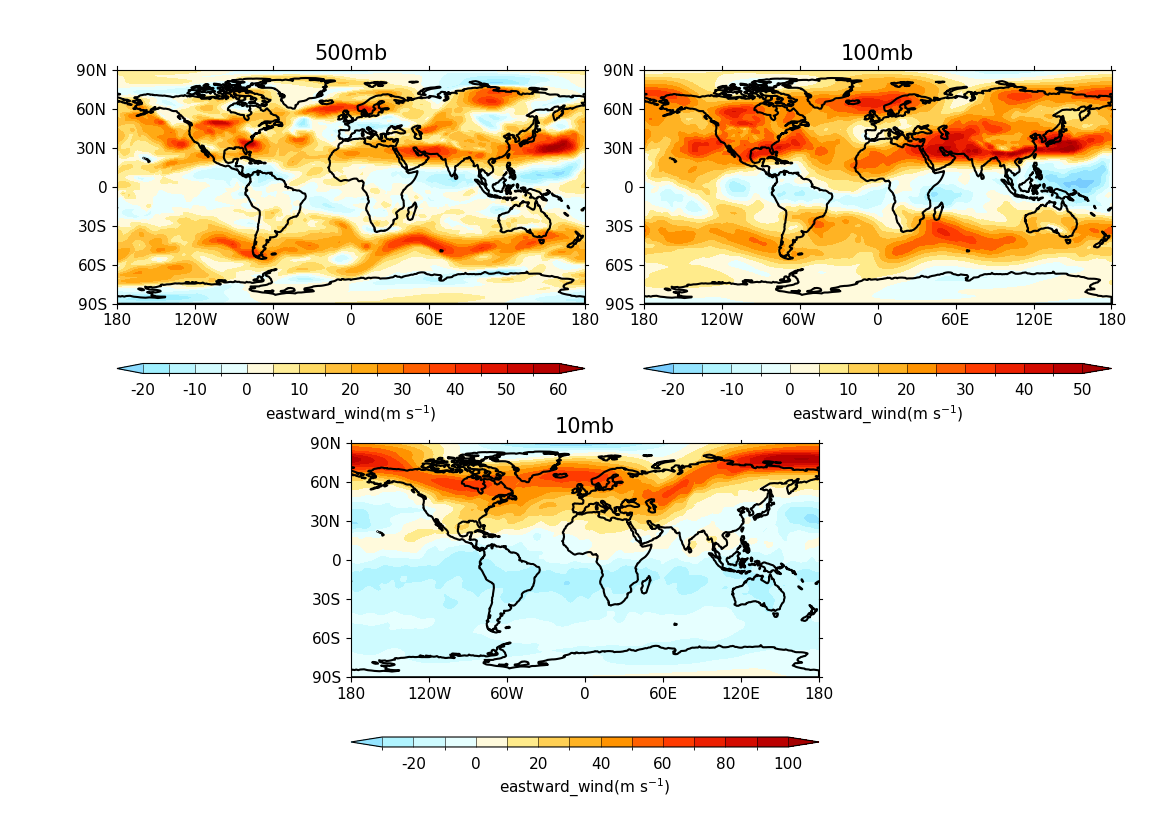
Making a single figure with multiple plots on it, where
the positions of the individual plots are set explicitly#
fl = cf.read(f"{self.data_dir}/ggap.nc")
f = fl.select_by_identity("eastward_wind")[0]

cfp.gopen(user_position=True)

cfp.gpos(xmin=0.1, xmax=0.5, ymin=0.55, ymax=1.0)
cfp.con(f.subspace(Z=500), title="500mb", lines=False)

cfp.gpos(xmin=0.55, xmax=0.95, ymin=0.55, ymax=1.0)
cfp.con(f.subspace(Z=100), title="100mb", lines=False)

cfp.gpos(xmin=0.3, xmax=0.7, ymin=0.1, ymax=0.55)
cfp.con(f.subspace(Z=10), title="10mb", lines=False)

cfp.gclose()