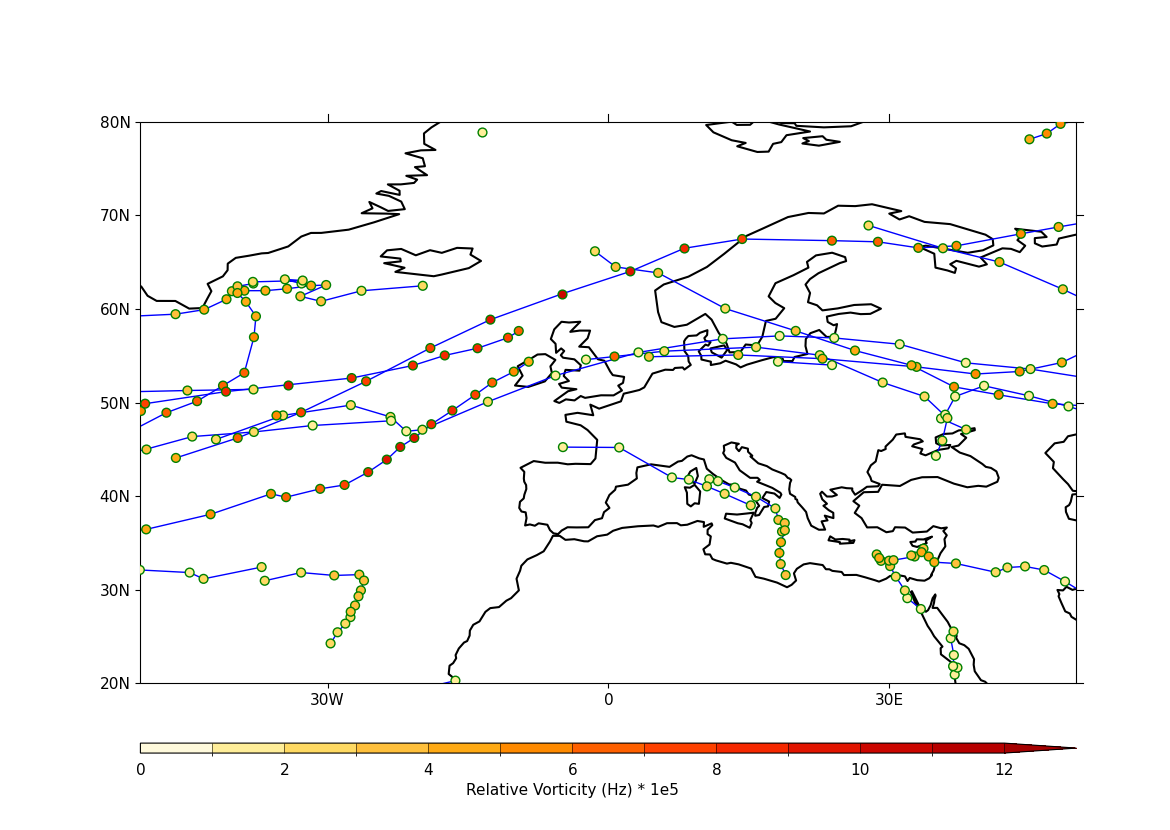
Example 42a: Tracks with labelled data points#
Plotting tracks with labelling of the discrete data
points forming the trajectory shown
with intensity matched to a displayed colour scale using
the legend keyword#
f = cf.read(f"cfplot_data/ff_trs_pos.nc")[0]

cfp.mapset(lonmin=-50, lonmax=50, latmin=20, latmax=80)
g = f.subspace(time=cf.wi(cf.dt("1979-12-01"), cf.dt("1979-12-10")))
g = g * 1e5
cfp.levs(0, 12, 1, extend="max")
cfp.cscale("scale1", below=0, above=13)

cfp.traj(
    g,
    legend=True,
    markersize=40.0,
    colorbar_title="Relative Vorticity (Hz) * 1e5",
)