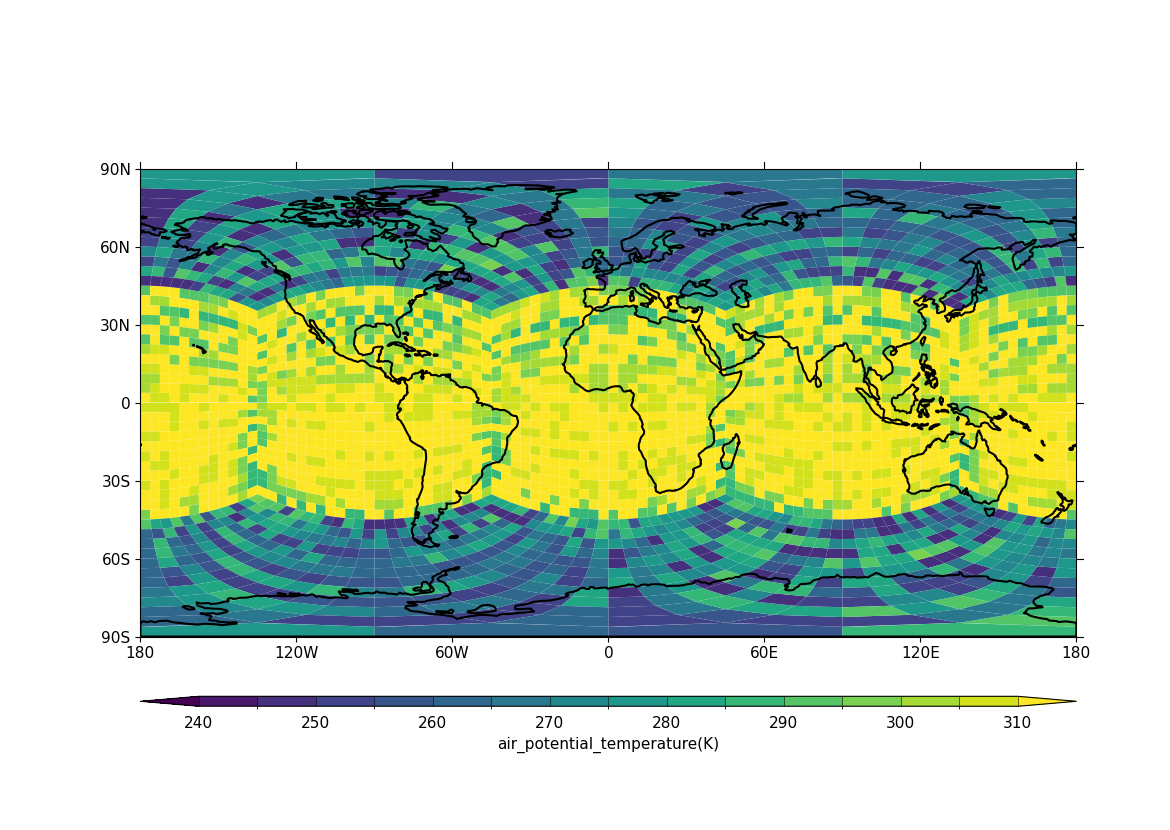
Example 24a: UGRID blockfill plot with LFRic cubed sphere mesh output#
Making a blockfill plot of UGRID data, specifically LFRic
model output which is defined on a cubed sphere mesh#
f = cf.read("cfplot_data/lfric_initial.nc")

# Select the relevant fields for the objects required for the plot,
# taking the air potential temperature as a variable to choose to view.
pot = f.select_by_identity("air_potential_temperature")[0]
lats = f.select_by_identity("latitude")[0]
lons = f.select_by_identity("longitude")[0]
faces = f.select_by_identity("cf_role=face_edge_connectivity")[0]

# Reduce the variable to match the shapes
pot = pot[4,:]

cfp.levs(240, 310, 5)

cfp.con(
    f=pot, face_lons=lons, face_lats=lats,
    face_connectivity=faces, lines=False, blockfill=True,
)