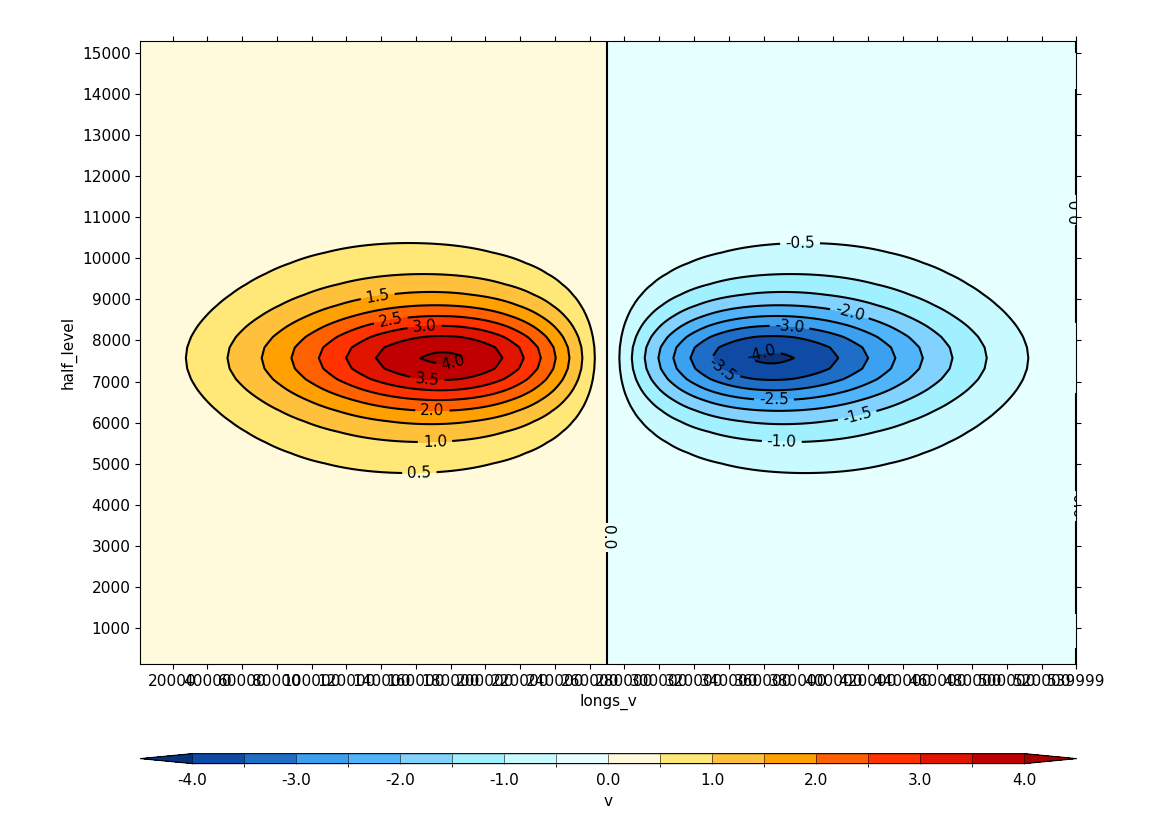
Example 20: Case where user-defined axis labels are required#
A case where a default plot has an axis with labels
that are too dense and overlap, such that user-defined
axis labels are required (see Example 21)#
fl = cf.read(f"{self.data_dir}/Geostropic_Adjustment.nc")
f = fl.select_by_identity("ncvar%v")[0]

cfp.con(f.subspace[9])