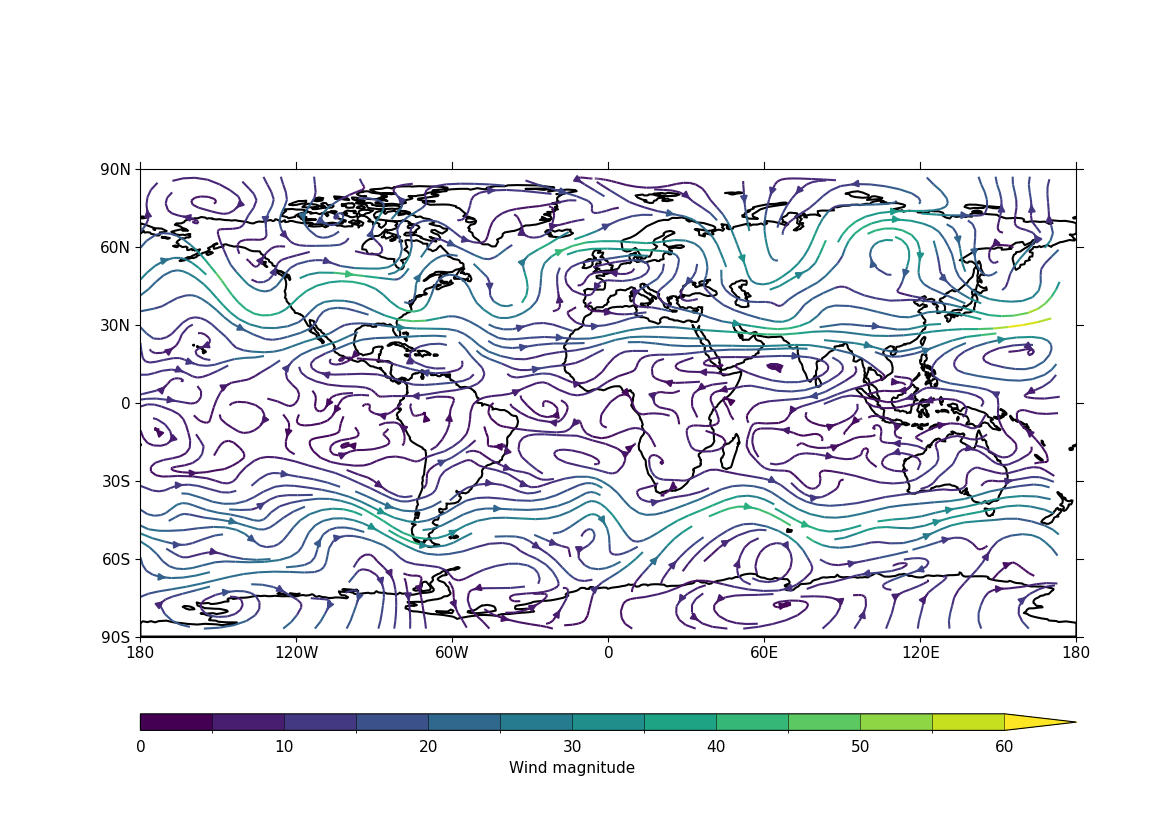
Example 16c: Stream plot in a colour scale#
Making an enhanced stream plot where the streamlines are
shown in colours mapped to a colour scale corresponding to
the magnitude of the underlying data#
f = cf.read(f"cfplot_data/ggap.nc")

u = f.select_by_identity("eastward_wind")[0]
v = f.select_by_identity("northward_wind")[0]

u = u.subspace(pressure=500)
v = v.subspace(pressure=500)

u = u.anchor("X", -180)
v = v.anchor("X", -180)

magnitude = (u--2 + v--2) -- 0.5
mag = np.squeeze(magnitude.array)

cfp.levs(0, 60, 5, extend="max")
cfp.cscale("viridis", ncols=13)
cfp.gopen()
cfp.stream(u=u, v=v, density=2, color=mag)
cfp.cbar(
    levs=cfp.plotvars.levels,
    position=[0.12, 0.12, 0.8, 0.02],
    title="Wind magnitude",
)
cfp.gclose()