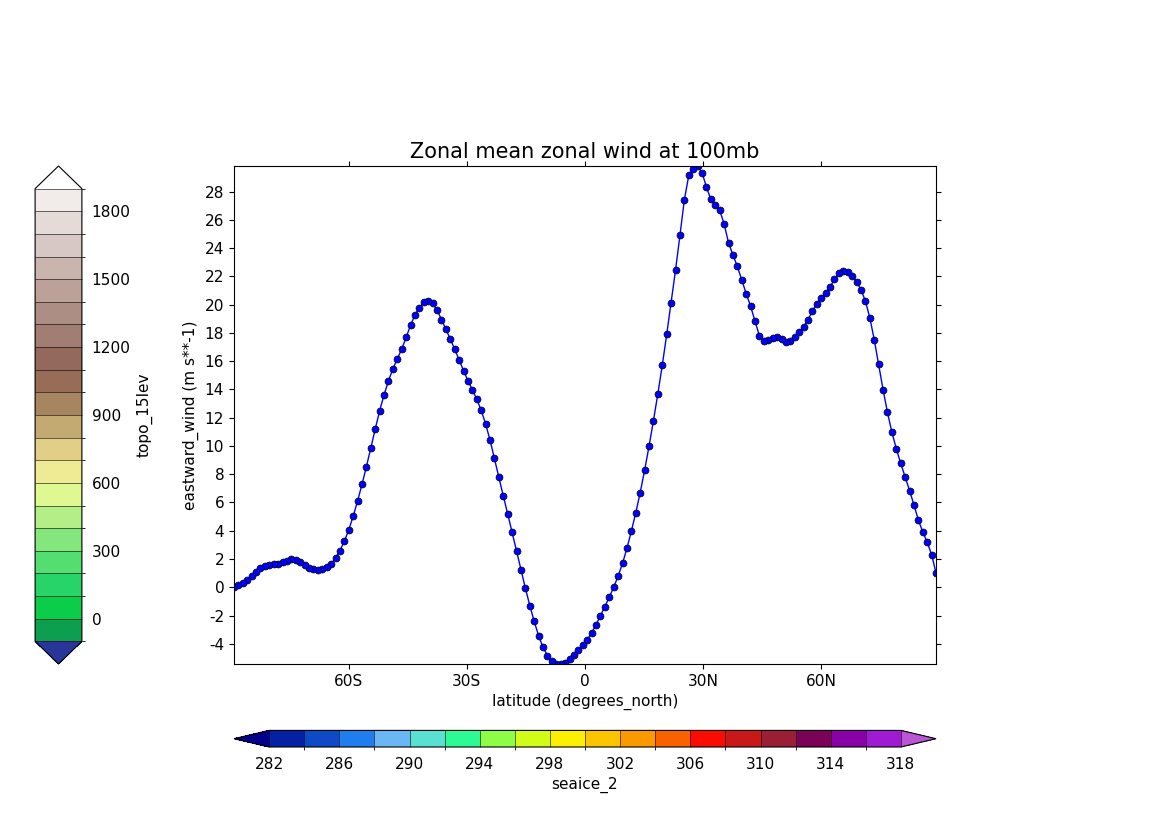
Example 19c: Accomodating more than one colour bar#
Using the approach to make a single figure with multiple plots
on it to fit an extra colour bar#
fl = cf.read(f"{self.data_dir}/ggap.nc")
f = fl.select_by_identity("eastward_wind")[0]

g = f.collapse("X: mean")

cfp.gopen(user_position=True)

cfp.gpos(xmin=0.2, ymin=0.2, xmax=0.8, ymax=0.8)
cfp.lineplot(
    g.subspace(pressure=100),
    marker="o",
    color="blue",
    title="Zonal mean zonal wind at 100mb",
)

cfp.cscale("seaice_2", ncols=20)
levs = np.arange(282, 320, 2)
cfp.cbar(levs=levs, position=[0.2, 0.1, 0.6, 0.02], title="seaice_2")

cfp.cscale("topo_15lev", ncols=22)
levs = np.arange(-100, 2000, 100)
cfp.cbar(
    levs=levs,
    position=[0.03, 0.2, 0.04, 0.6],
    orientation="vertical",
    title="topo_15lev",
)

cfp.gclose()