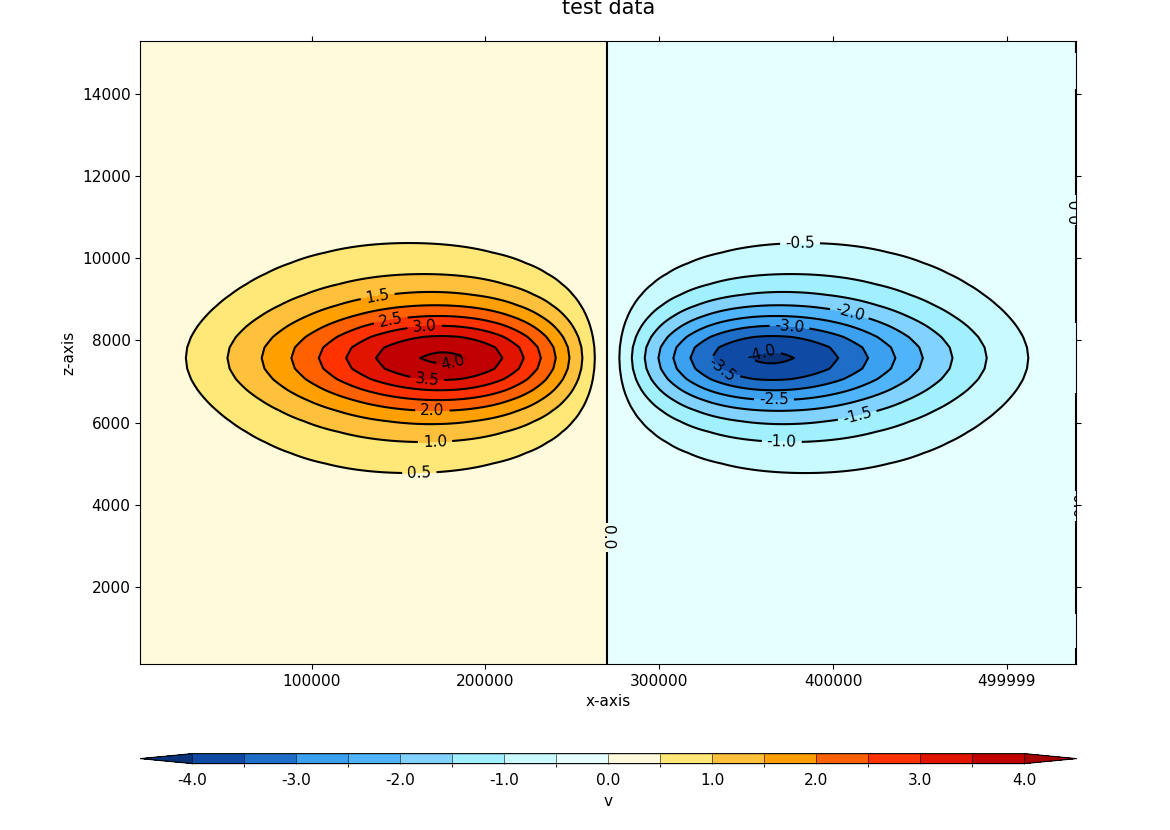
Example 21a: User-defined axes#
Adjusting the default axes labelling to prevent overlapping
labels#
f = cf.read(f"cfplot_data/Geostropic_Adjustment.nc")[0]

cfp.con(
    f.subspace[9],
    title="test data",
    xticks=np.arange(5) * 100000 + 100000,
    yticks=np.arange(7) * 2000 + 2000,
    xlabel="x-axis",
    ylabel="z-axis",
)
