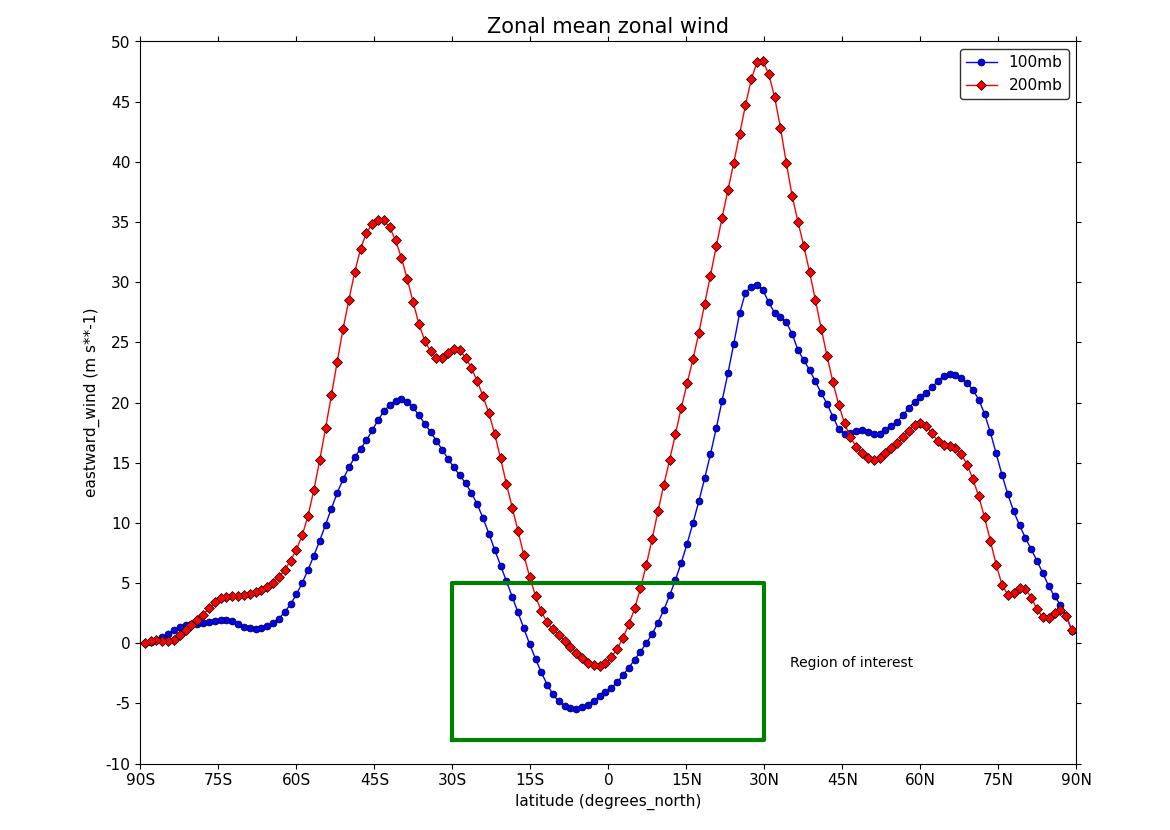
Example 28: Line plot with a legend#
Adding a legend to annotate a line plot with multiple
plotted lines#
fl = cf.read(f"{self.data_dir}/ggap.nc")
f = fl.select_by_identity("eastward_wind")[0]

g = f.collapse("X: mean")

xticks = [-90, -75, -60, -45, -30, -15, 0, 15, 30, 45, 60, 75, 90]
xticklabels = [
    "90S",
    "75S",
    "60S",
    "45S",
    "30S",
    "15S",
    "0",
    "15N",
    "30N",
    "45N",
    "60N",
    "75N",
    "90N",
]
xpts = [-30, 30, 30, -30, -30]
ypts = [-8, -8, 5, 5, -8]

cfp.gset(xmin=-90, xmax=90, ymin=-10, ymax=50)

cfp.gopen()
cfp.lineplot(
    g.subspace(pressure=100),
    marker="o",
    color="blue",
    title="Zonal mean zonal wind",
    label="100mb",
)
cfp.lineplot(
    g.subspace(pressure=200),
    marker="D",
    color="red",
    label="200mb",
    xticks=xticks,
    xticklabels=xticklabels,
    legend_location="upper right",
)
cfp.plotvars.plot.plot(xpts, ypts, linewidth=3.0, color="green")
cfp.plotvars.plot.text(
    35, -2, "Region of interest", horizontalalignment="left"
)
cfp.gclose()