Example 6: Latitude-pressure plot at set longitude#
Making a plot for a given longitude value with latitude and
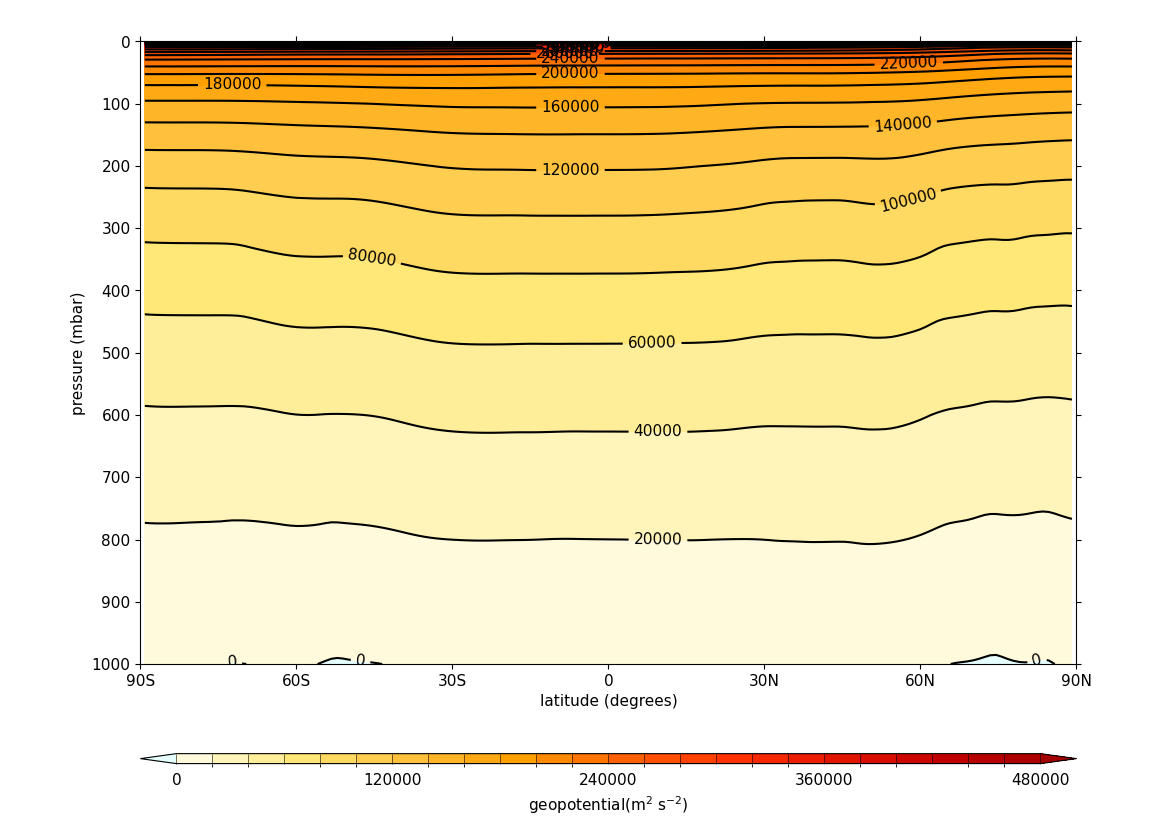
pressure as the axes#
fl = cf.read(f"{self.data_dir}/ggap.nc")
f = fl.select_by_identity("geopotential")[0]

cfp.con(f.subspace(longitude=0))